
Popular tech juggernaut Meta Platforms, Inc. (META) will release its fourth quarter and full-year 2023 results tomorrow. Prior to that, the company’s CEO is scheduled to face the Senate Judiciary Committee regarding child exploitation on social media. In recent times, the company has also faced a number of related lawsuits. This could mean regulatory action on META’s social media platforms.
Despite this, the company robustly rebounded last year from its lows. With the address of shareholder concerns, the change of attitude has caused its sales to grow 23% year-over-year in the third quarter, driven by growth in digital advertising and gain in market share over rivals.
While the ad market is expected to be rocky this year, META’s core business remains resilient in the face of it. Furthermore, the company’s market capitalization topped $1 trillion recently, marking the first time since 2021. META’s focus on cost-cutting and its “year of efficiency” after a dismal 2022 performance is seemingly benefitting the company.
Against this backdrop, let’s look at the trends of META’s key financial metrics to understand why the stock could be a solid buy ahead of its upcoming earnings.
Financial Performance of META: A Comprehensive Overview from March 2021 to September 2023
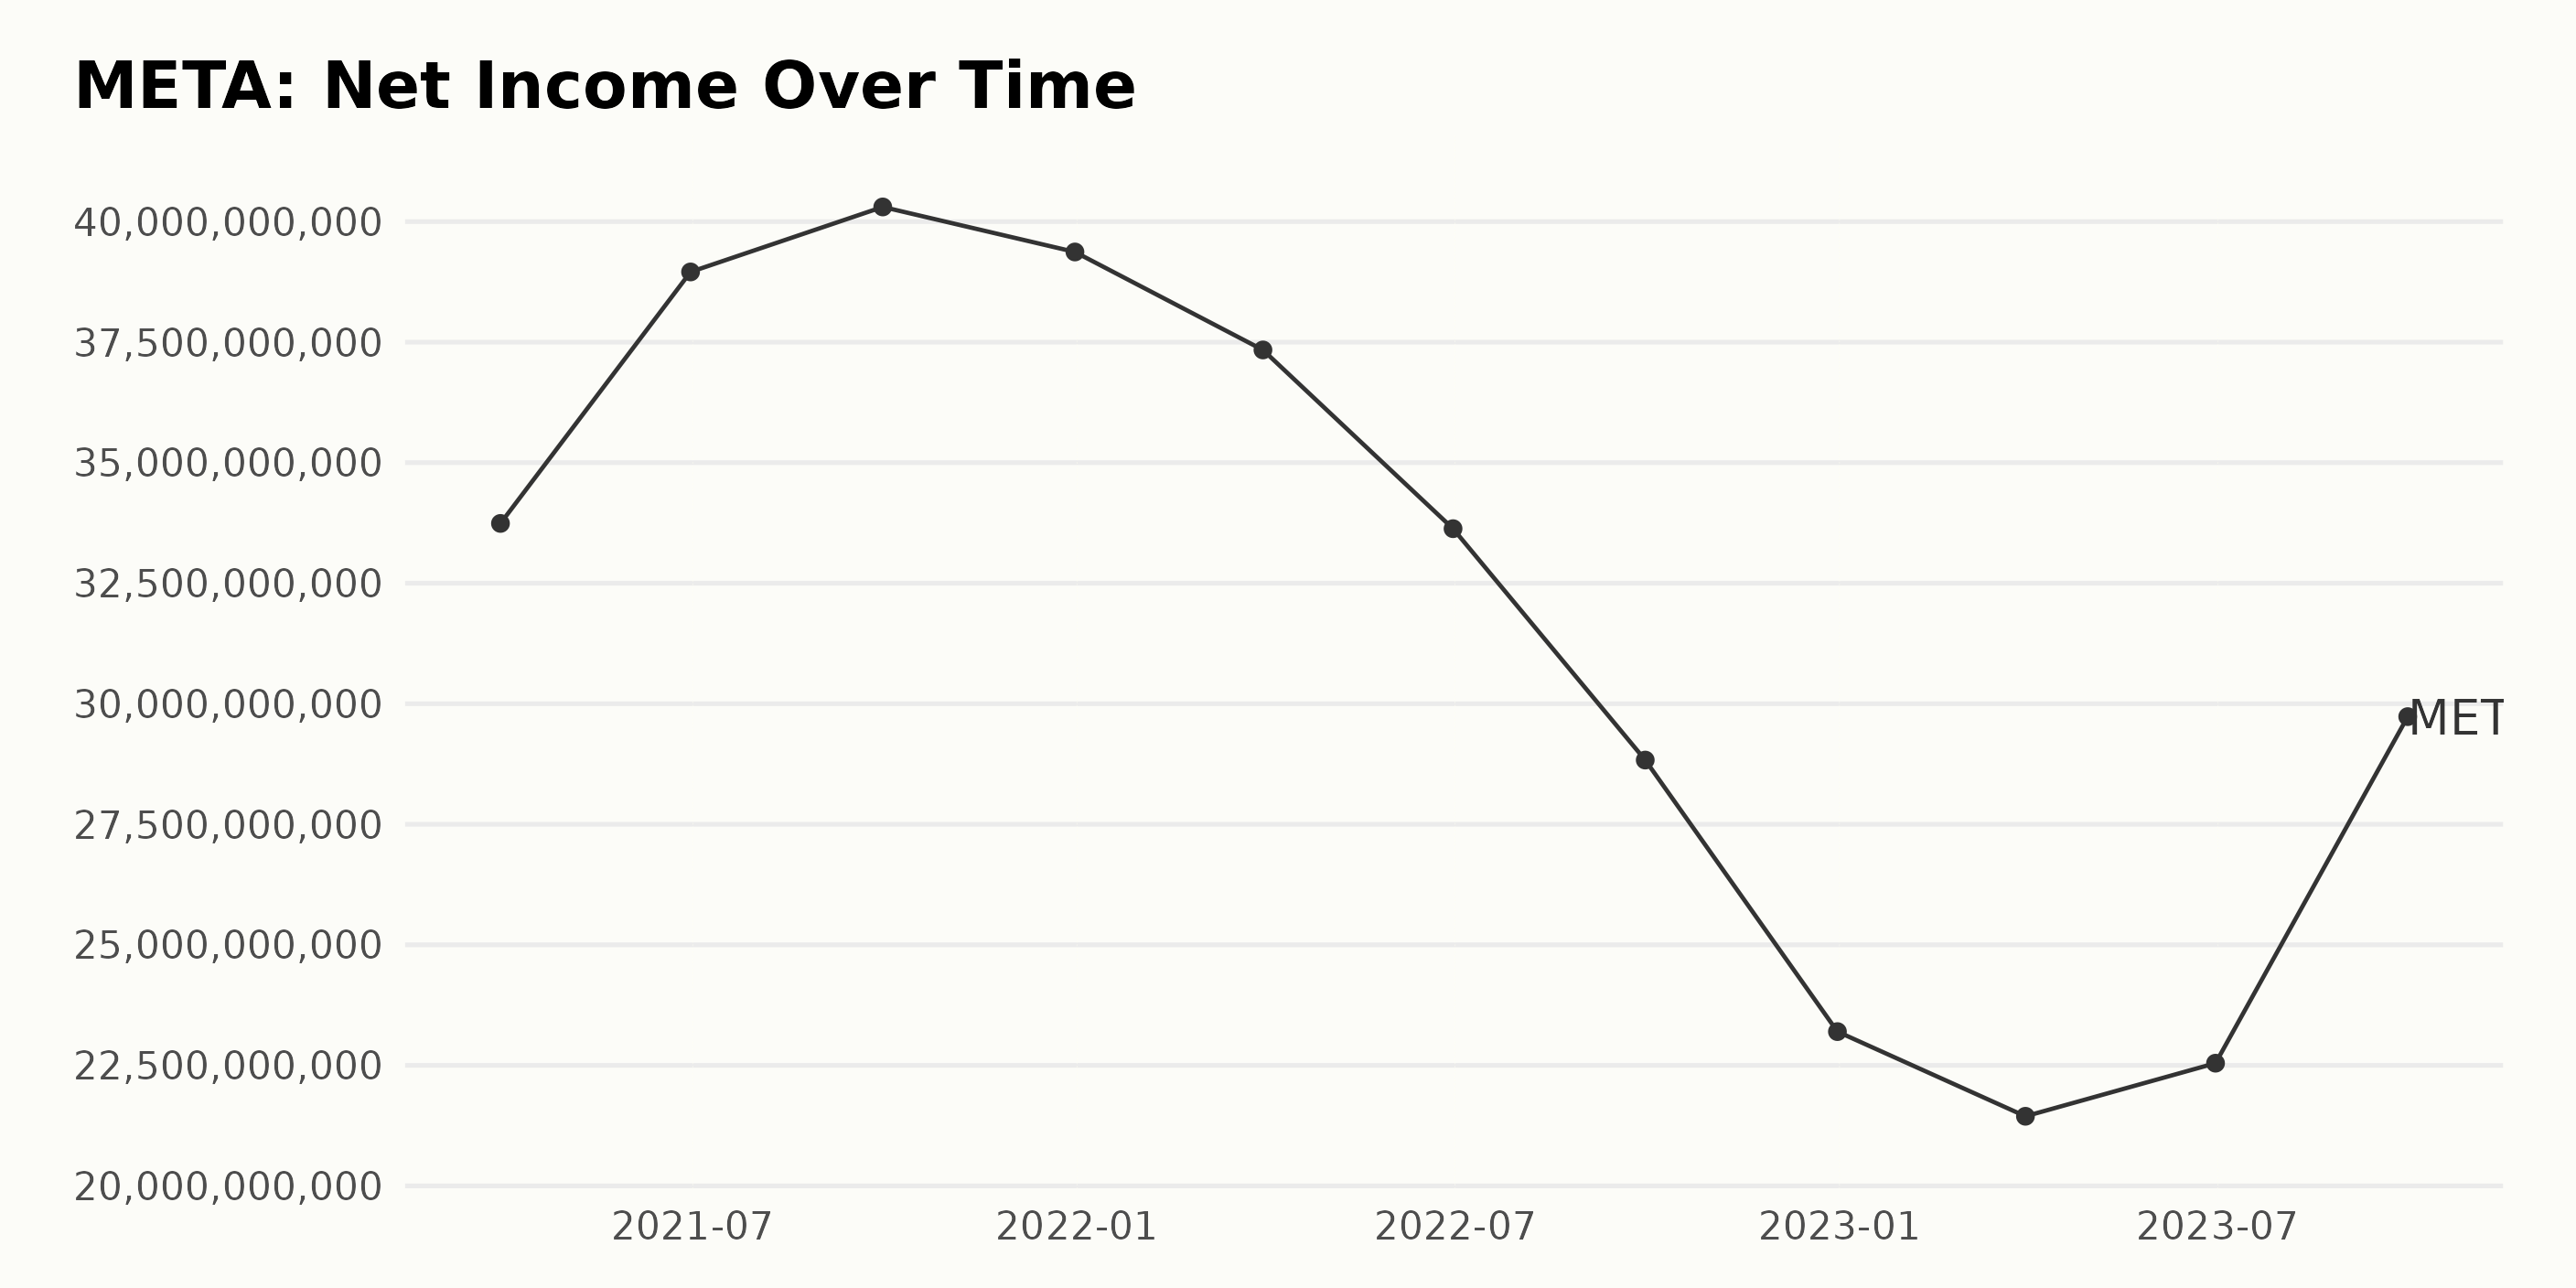
The trailing-12-month net income of META indicates a trend of sharp fluctuation over the period from March 31, 2021, to September 30, 2023.
- On March 31, 2021, the company posted a net income of $33.74 billion.
- There was steady growth in the second and third quarters of 2021, with the net income reaching $38.96 billion and $40.3 billion, respectively.
- End-year figures on December 31, 2021, declined slightly to $39.37 billion.
- A further downward trend was observed in 2022, with the first quarter recording $37.34 billion and the second quarter decreasing to $33.63 billion.
- There was a significant reduction in the third quarter of 2022, where net income fell to $28.83 billion.
- The year ended on an even lower note, where December 31, 2022, recorded a further dip in net income to $23.2 billion.
- 2023 began on a softer note, with the first quarter reporting a net income of $21.44 billion.
- However, a slight increase was observed in the second quarter of 2023, when the net income rose to $22.54 billion.
- The most recent data, as of the third quarter of 2023, displays a bounce back to $29.73 billion.
Calculating the growth rate from the first and last value of the series indicates a decrease of $4.01 billion or approximately an 11% reduction in net income over this time span. This manifest trend suggests that META's financial performance experienced considerable instability during the period under review, with an overall decline despite minor recoveries. Emphasis on recent data observes increased efforts toward restoring financial health in the third quarter of 2023.
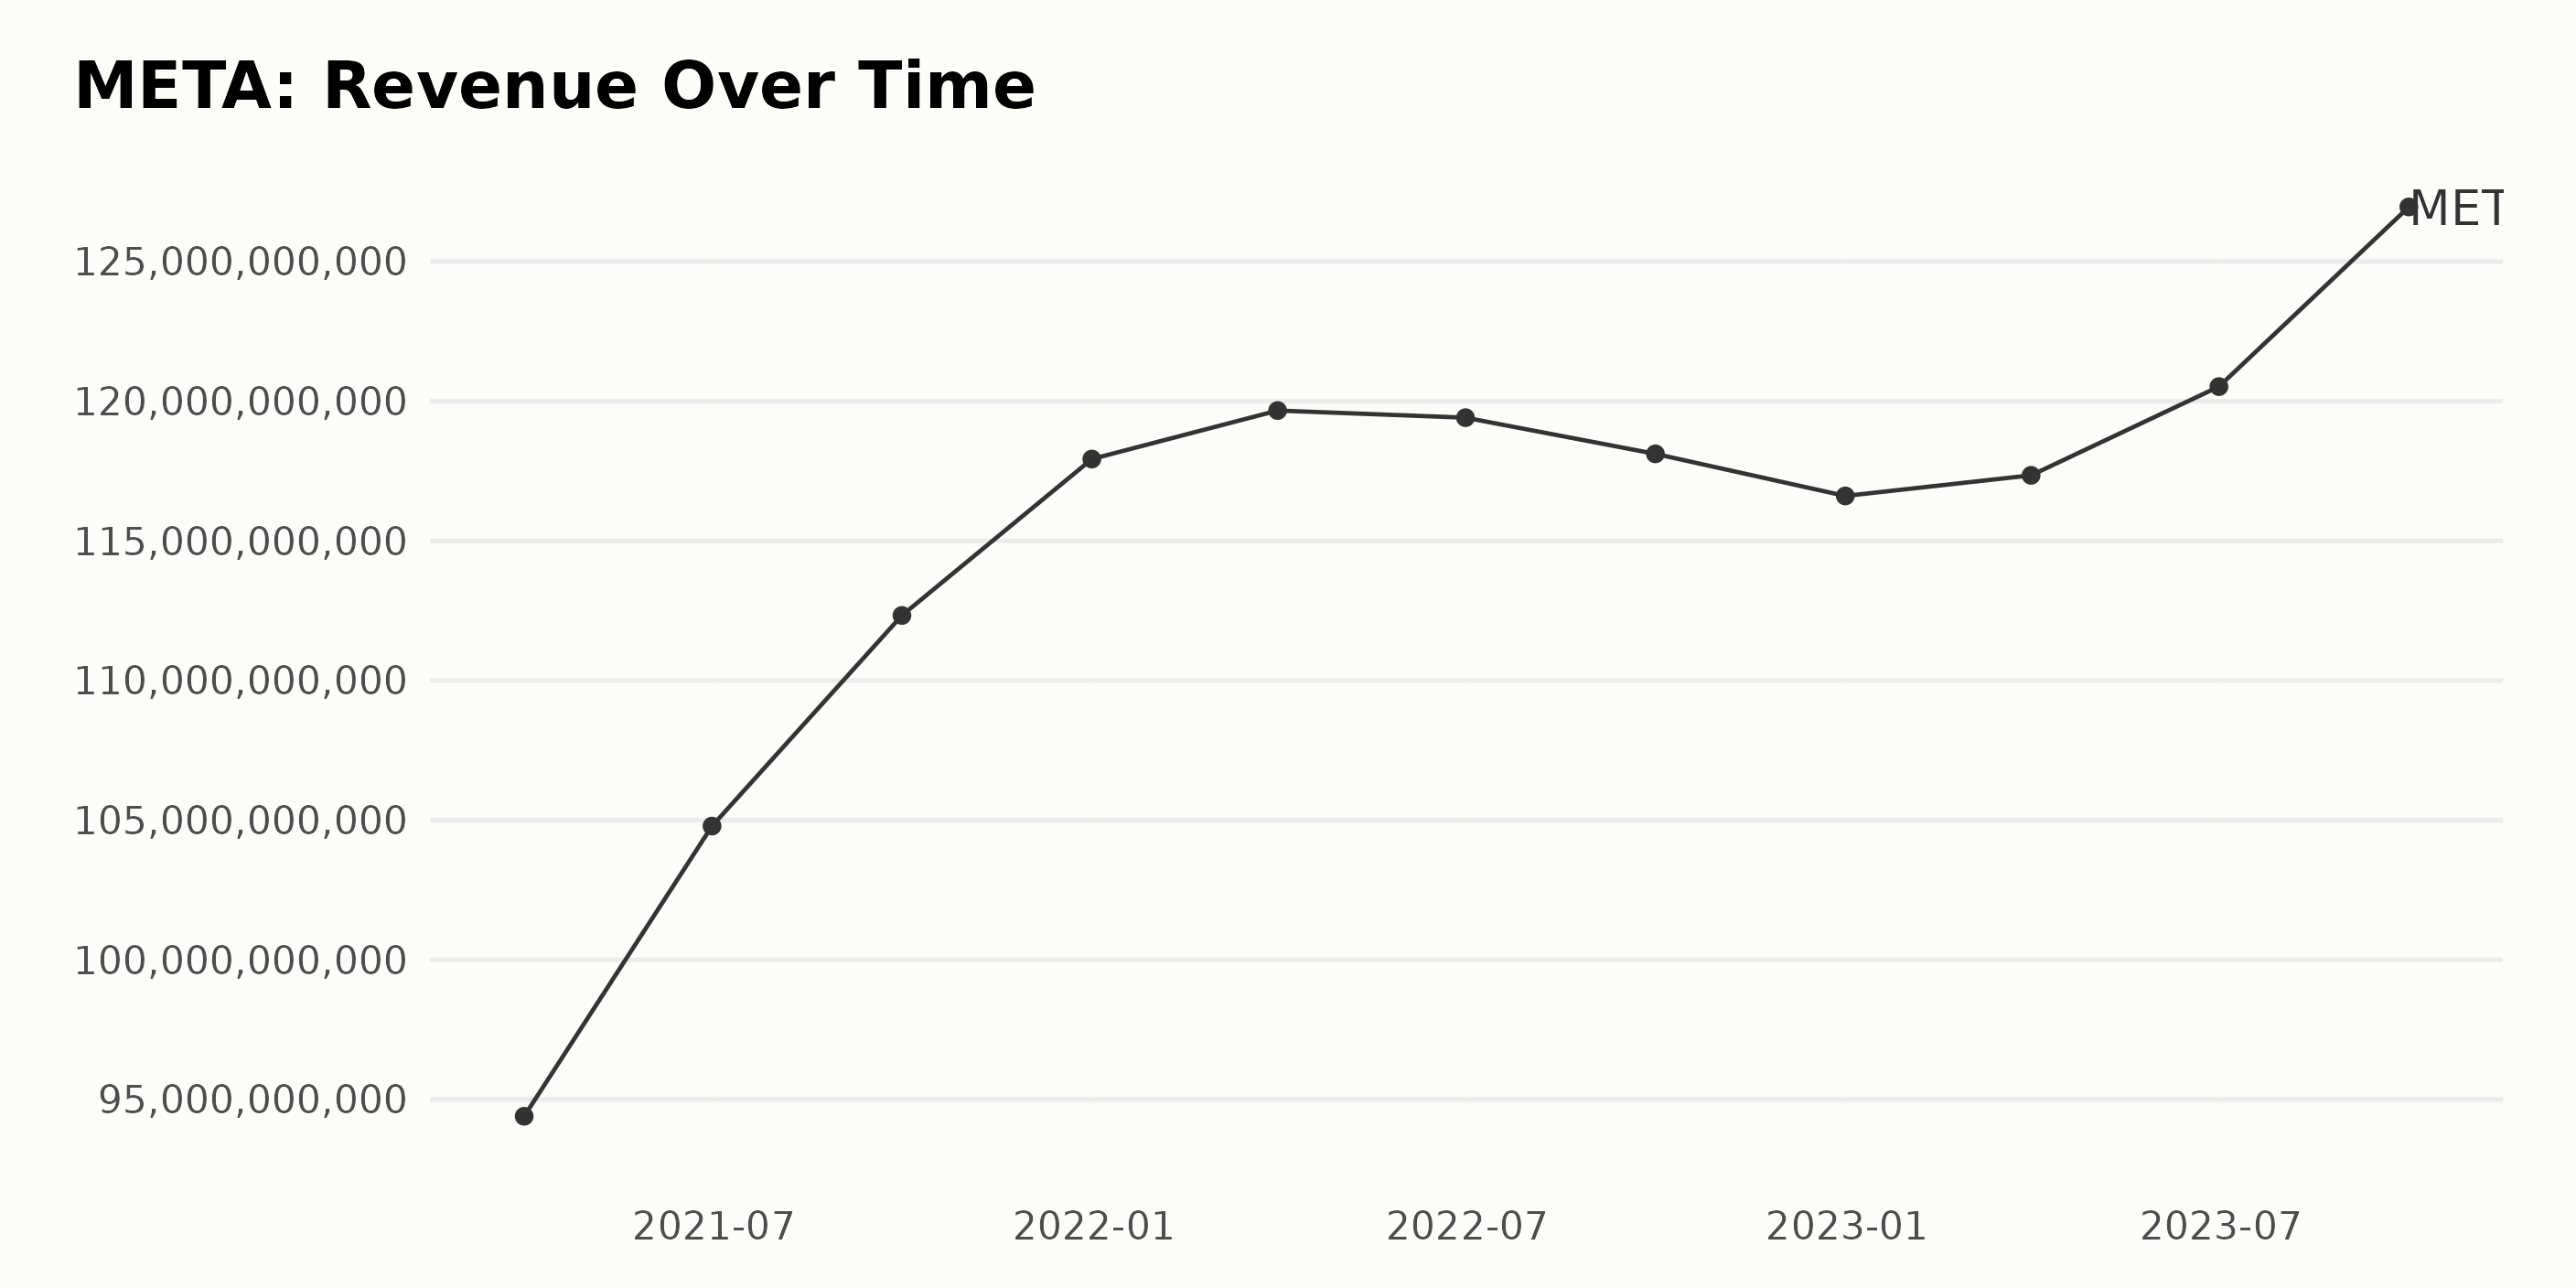
The trailing-12-month revenue of META has experienced some fluctuation over the years. Here is a summary of the trends observed:
- In March 2021, the revenue was at a significant $94.4 billion, then it steadily climbed, reaching a peak of $119.8 billion in June 2022.
- However, a noticeable drop was seen as the revenue fell to $116.6 billion in December 2022. This represents a decrease after a year of consistent growth.
- From the start of 2023, a gradual increase was observed, with the revenue finally reaching a high of $126.95 billion in September 2023, which is the last data point in the series.
In terms of growth rate calculated from the first value to the last, META saw an increase of approximately $32.55 billion in its revenue. This represents a favorable total growth rate of roughly 34.49% over the course of these years under review.
It's important to note that the revenue experienced a few downturns, particularly between June and December 2022, yet managed to recover and grow significantly by September 2023. The recent trend from the start of 2023 until September shows a steady upward trajectory, indicating a robust financial performance by META.
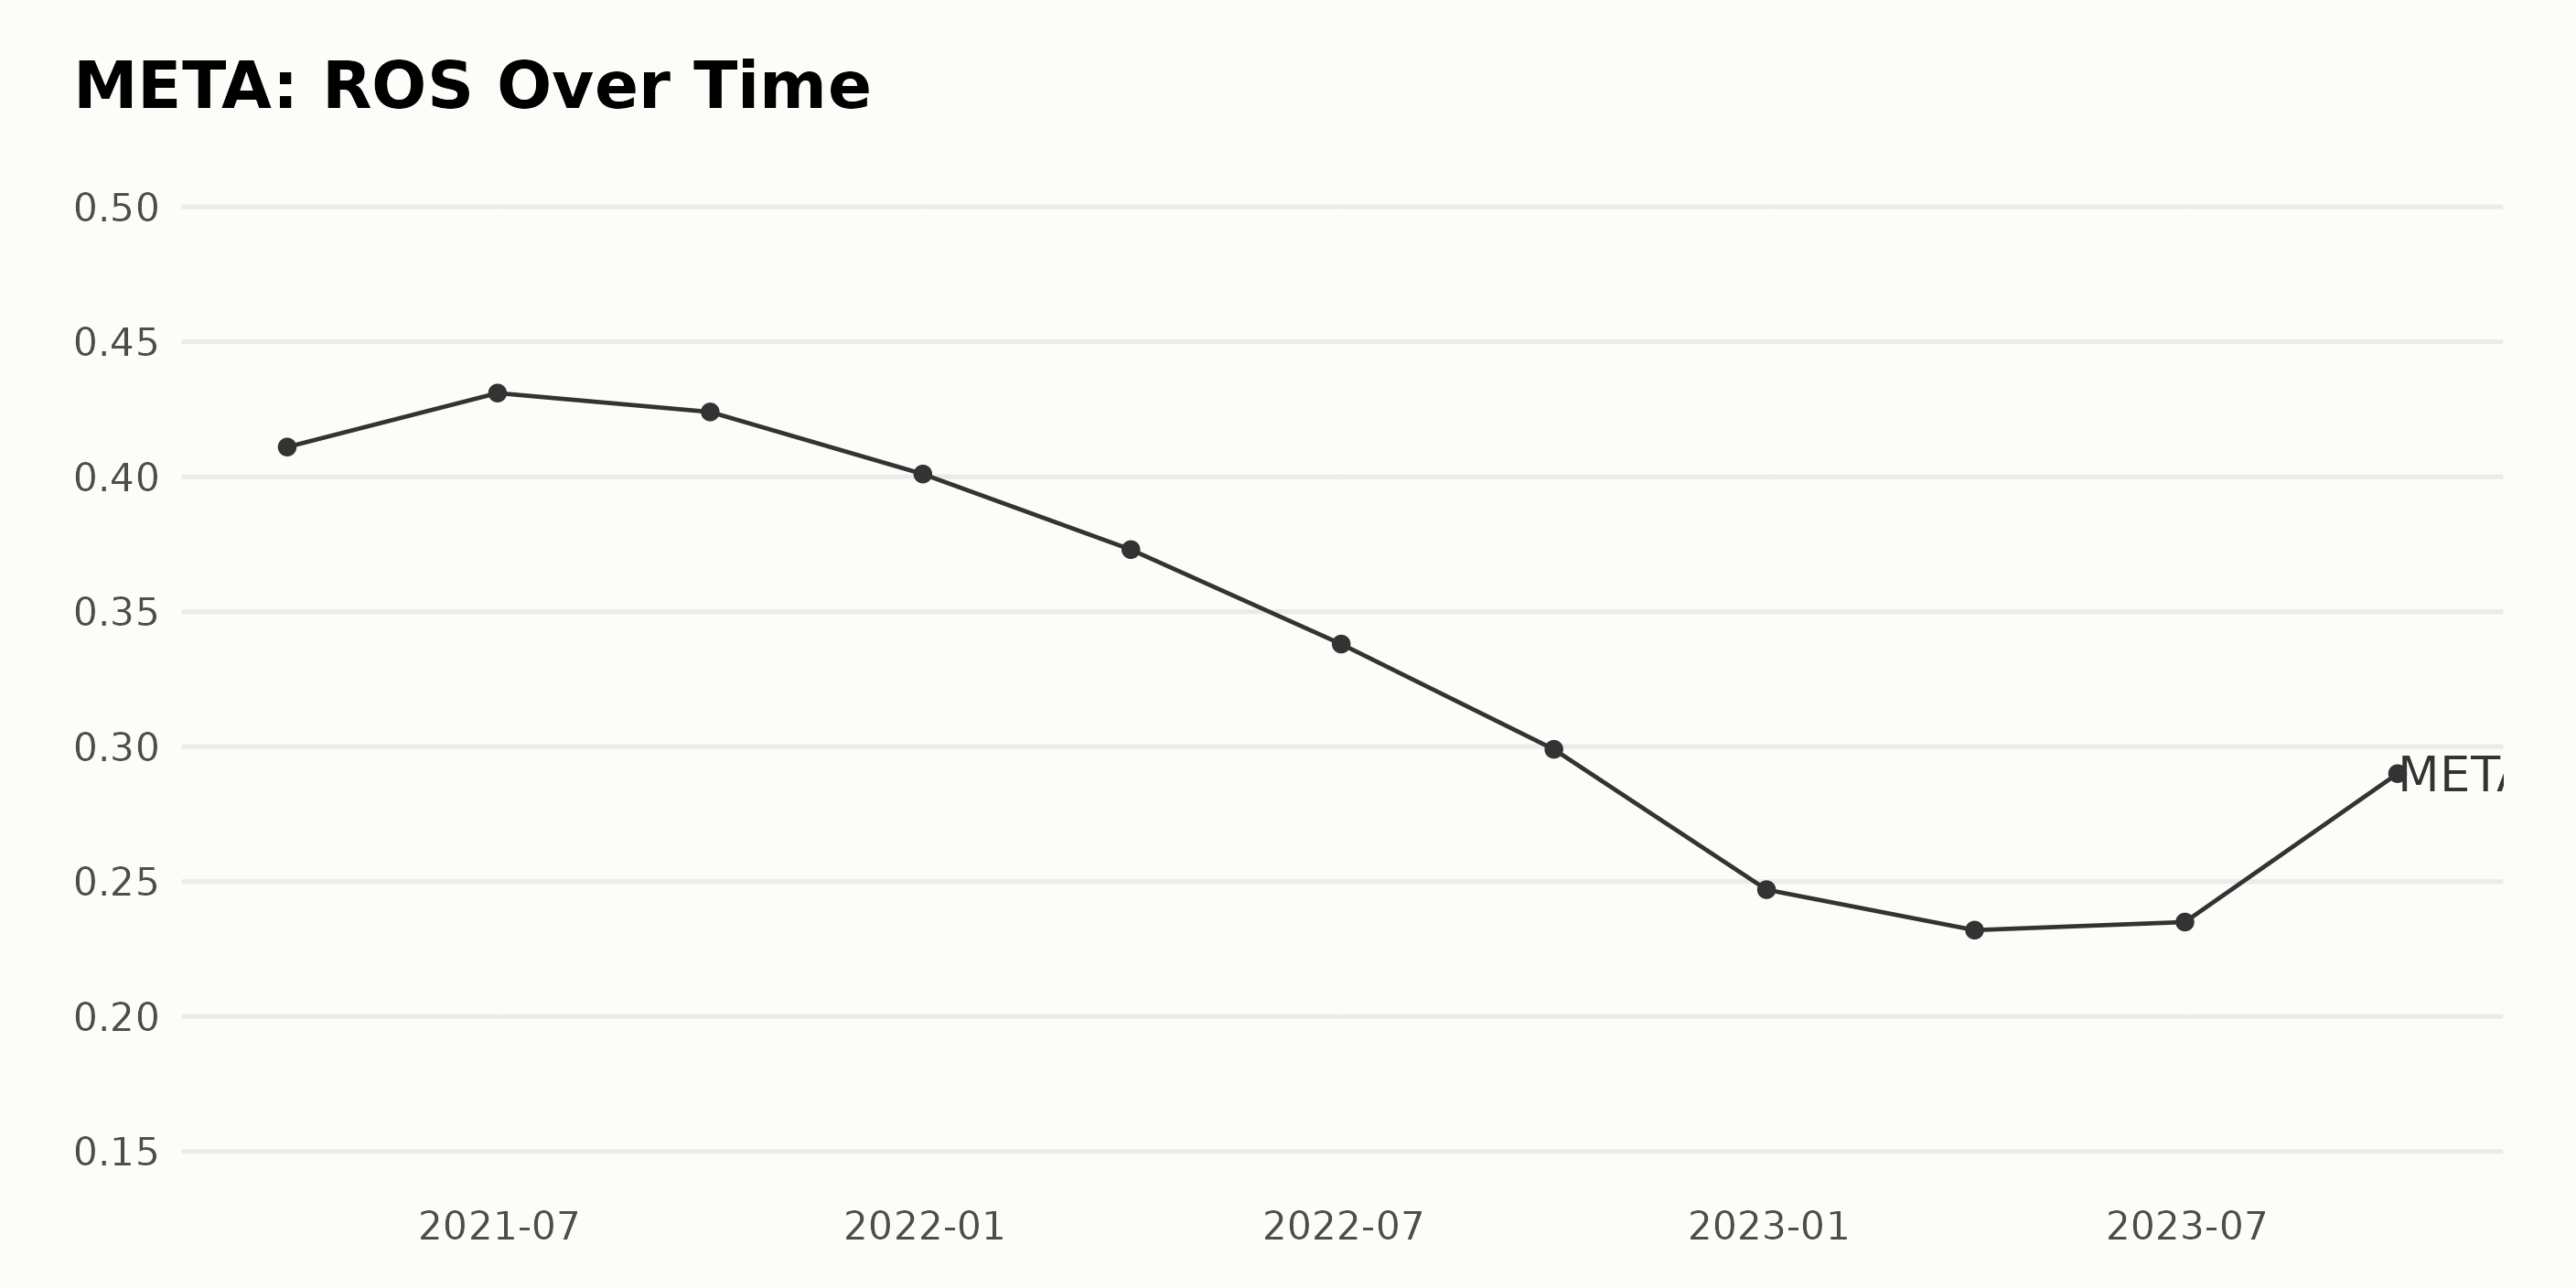
The Return On Sales (ROS) of META displays a trend of gradual decline over an extended time period from March 2021 to September 2023.
- The ROS of META started at 0.41 in March 2021.
- By June 2021, the ROS had increased slightly to 0.43.
- However, it later dropped marginally to 0.424 in September 2021 and more significantly to 0.401 by the end of December 2021.
- In 2022, there was a consistent dip in ROS throughout the year, reaching 0.373 in March, 0.338 in June, 0.299 in September, and ending at 0.247 in December.
- The first quarter of 2023 witnessed a small dip to 0.232 in March but then rose slightly to 0.235 in June.
- Interestingly, there was a notable increase by the end of the third quarter of 2023, reaching 0.29.
Calculating the growth rate, which is the change from its start in March 2021 to its last recorded point in September 2023, META's ROS has decreased overall by around 29%, indicating a downward trend in its ROS value over the given period.
This decline might suggest challenges in profitability for META during these periods. However, the rise toward the last quarter of 2023 suggests a positive turnaround, which might indicate a potential improvement in the firm's performance in that period. This makes the data from late 2023 particularly significant.
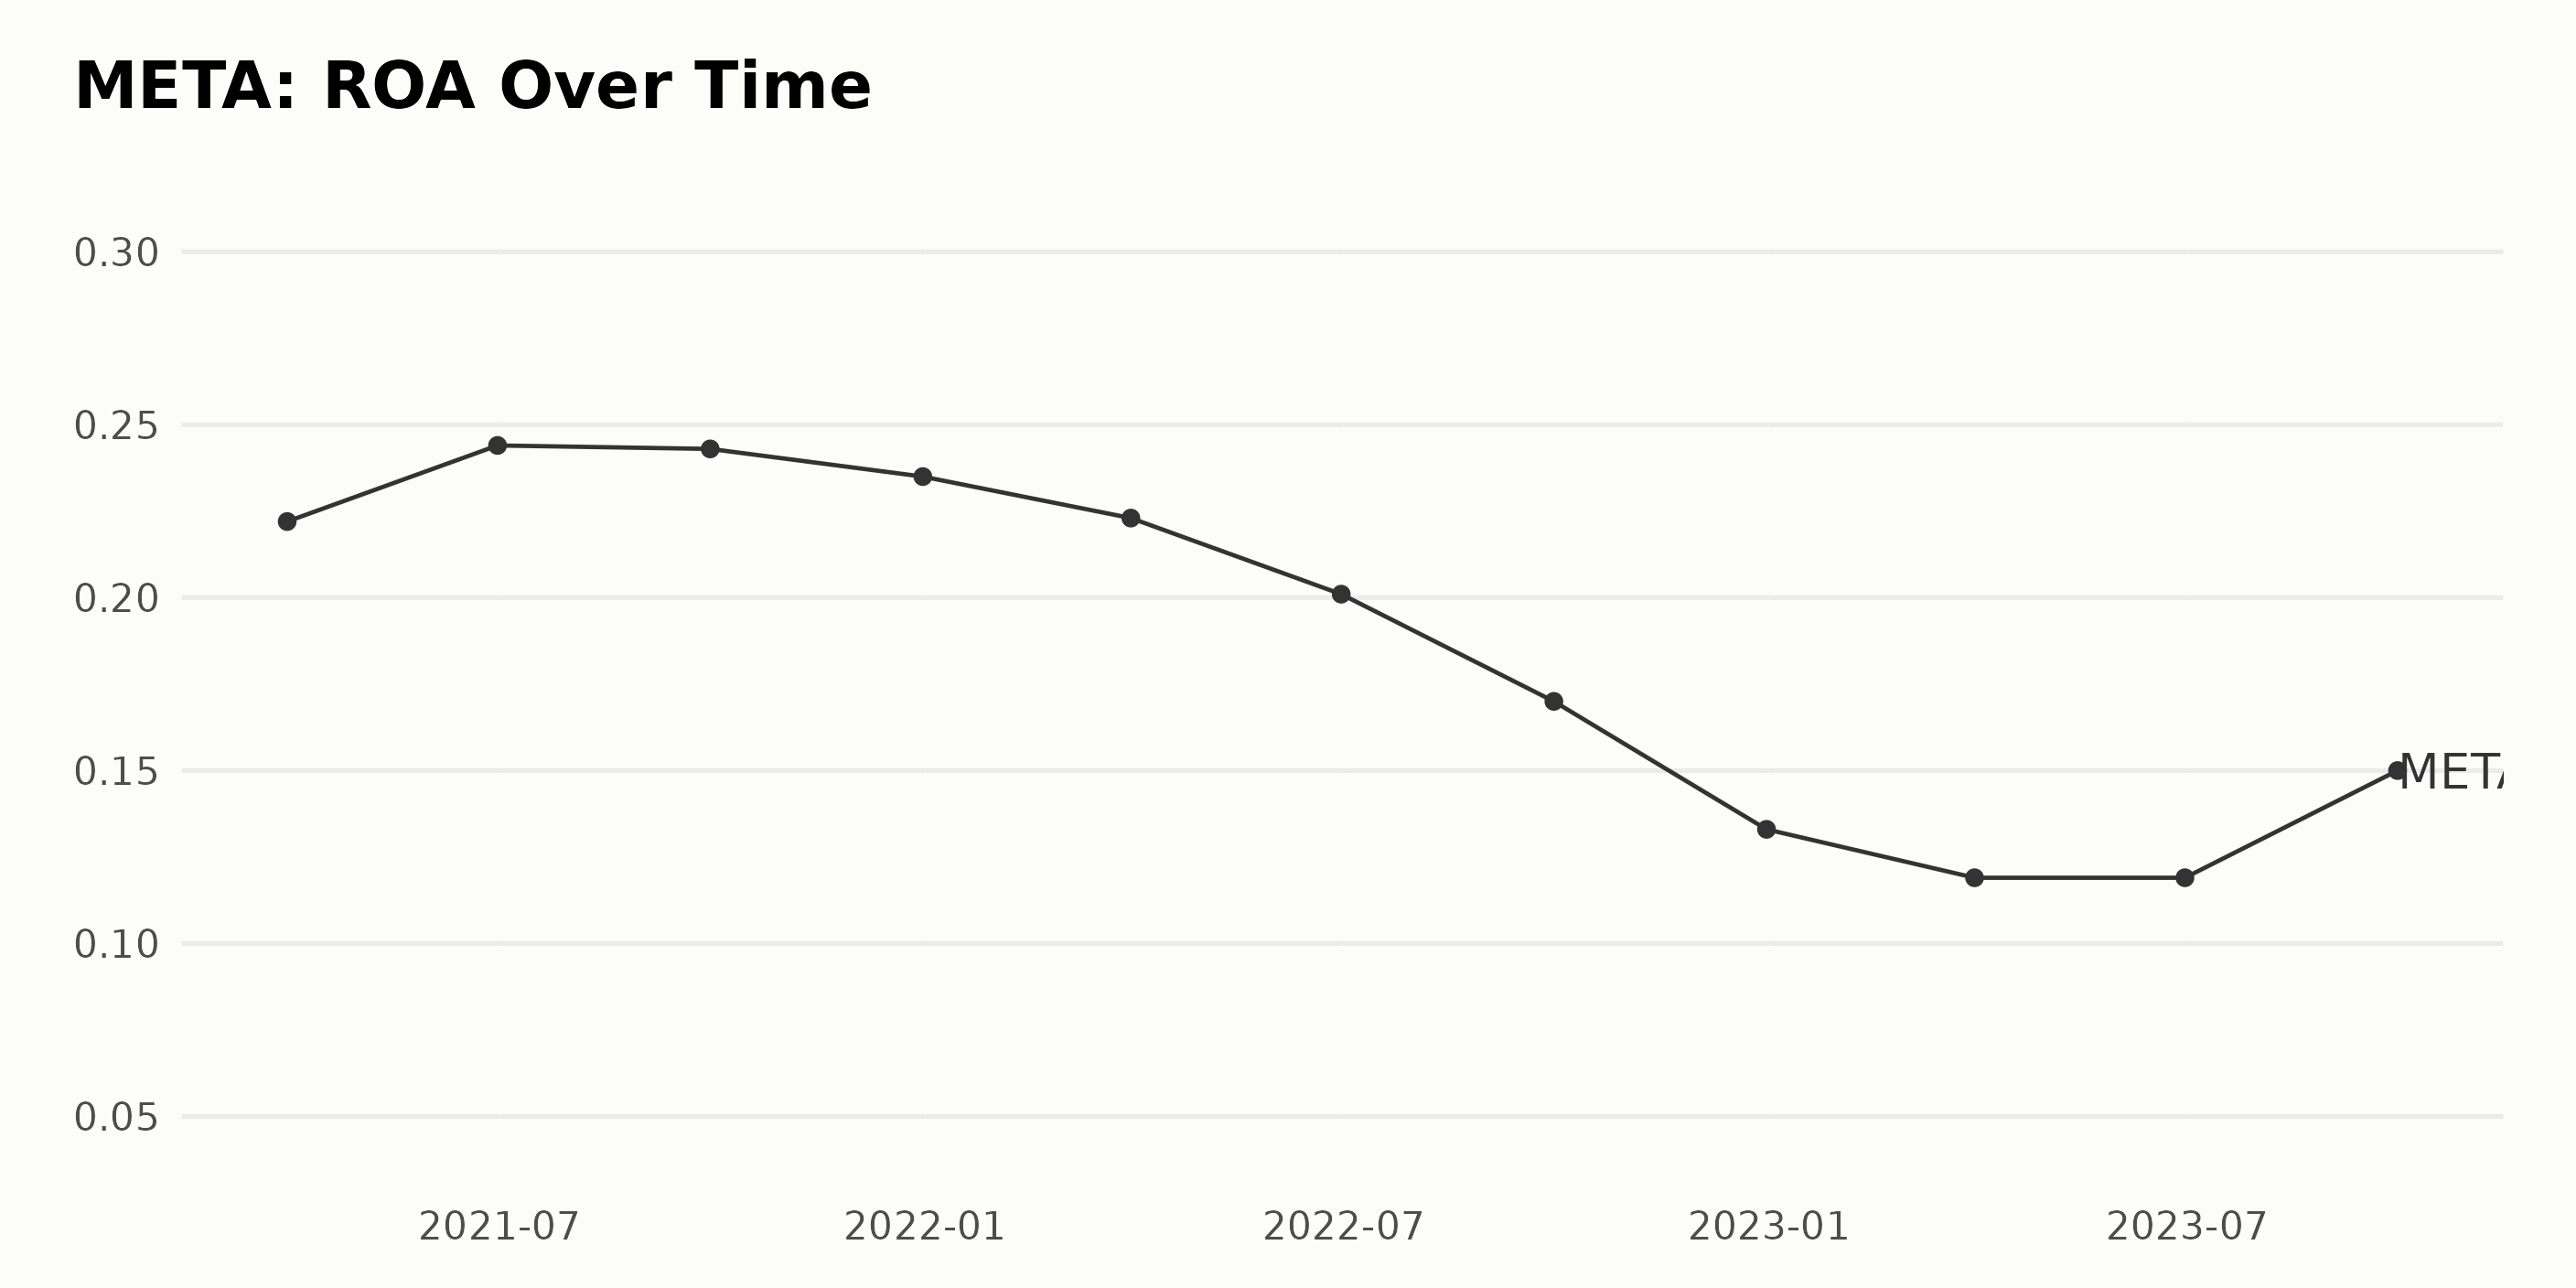
The trend for Return On Assets (ROA) for META has been inconsistent over the past couple of years, with both ups and downs noticeable in the series of data provided.
- On March 31, 2021, META's ROA stood at 22.2%.
- A slight uptrend was seen, with the ROA appreciating to 24.4% by June 30, 2021.
- This peak was followed by a minor reduction to 24.3% as of the end of September 2021.
- By the end of the year, specifically on December 31, 2021, the ROA experienced another fall, bringing the value down to 23.5%.
- In the first quarter of 2022, we recorded a decrease to 22.3% on March 31, 2022.
- Further declines were observed to 20.1% and 17.0% for June and September, respectively.
- There was a more significant downtrend toward the end of 2022 when ROA fell to 13.3% as of December 31, 2022.
- Moving into 2023, the ROA continued on a declining path, settling at 11.9% in both March and June.
- A resurgence was noted for the third quarter of 2023, with ROA rebounding back to 15.0%.
META’s ROA fluctuated throughout the analyzed time period, with signs of a rebound.
An Analysis of META's Six-Month Stock Performance: From Decrease to Accelerating Growth
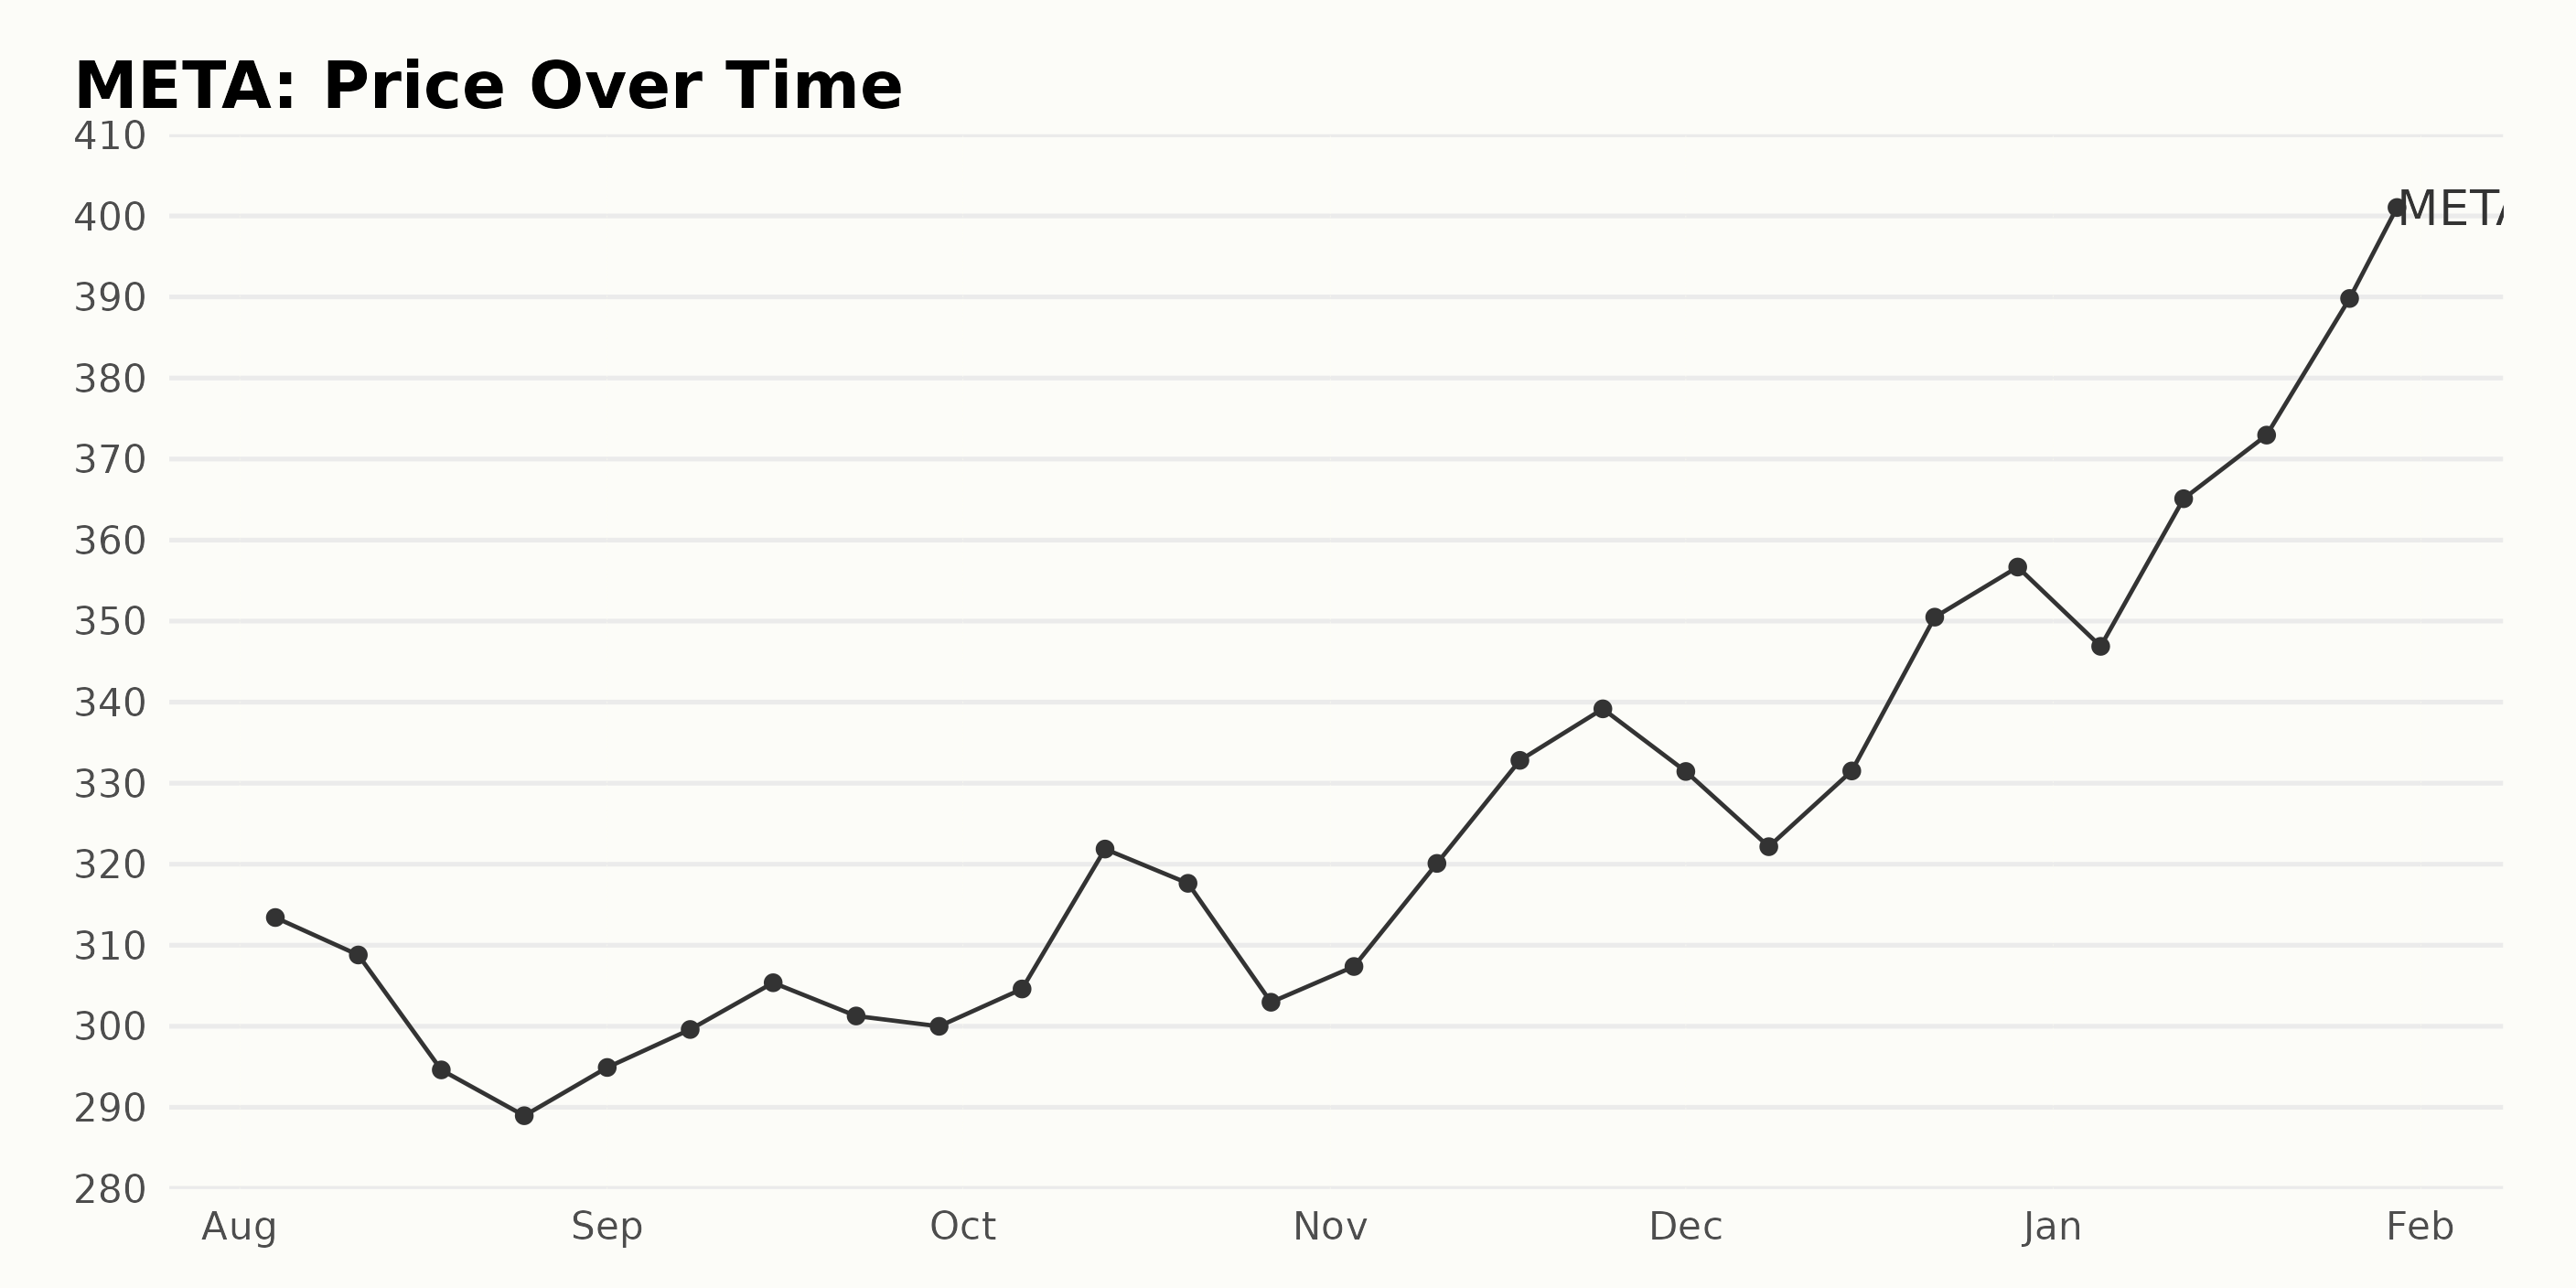
Upon reviewing the data provided focusing on the share price of META from August 4, 2023, to January 30, 2024, some trends and growth rates become apparent.
- Starting on August 4, 2023, at a share price of $313.42, a downward trend is observed through the end of that month, with the price falling to $288.96 by August 25, 2023.
- In September 2023, prices fluctuated but overall increased slightly from $294.92 at the beginning of the month to $299.99 by the end of the month.
- October 2023 showed increases in the first half of the month, peaking at $321.87 on October 13, 2023, followed by a decrease toward the end of the month down to $302.96 by October 27, 2023.
- In November 2023, a clear upward trend can be identified, starting at $307.38 and ending at an impressive $339.17 on November 24, 2023.
- The month of December 2023 also demonstrated upward momentum for META, with the share price growing from $331.44 on December 1, 2023, to $356.67 by December 29, 2023.
- The most noticeable growth occurred in January 2024. The share price started at $346.88 on January 5 but experienced significant growth to reach $400.06 by January 30, 2024.
In summary, over this approximate six-month period, the share price of META initially decreased through August, remained somewhat stagnant through September, fluctuated in October, and then showed a clear accelerating growth rate from November 2023 to January 2024. Here is a chart of META's price over the past 180 days.
Exploring META's Positive Trajectory: Quality, Sentiment, and Growth Insights
The POWR Ratings grade of META, a stock in the Internet category, has shown robust performance over the course of the data provided. It had a pattern of steady ascent, starting from an initial ranking of 6th position within its category in August 2023 and reaching an impressive 2nd place by October 2023. It maintained this superior rank until the latest available data from January 2024.
Also noteworthy is the progression of its POWR grade. The stock consistently earned a B (Buy) grade from August to October 2023. However, towards the end of October 2023, META's POWR grade improved to an A (Strong Buy) and has held this score through January 2024. As of January 31, the stock has an overall B (Buy) grade. To summarize, as per the latest data:
- The date: January 31, 2024
- The POWR Grade: B (Buy)
- Rank in Category: #2 out of a total of 52 Internet stocks.
This comprehensive view of META's performance indicates its strong standing among Internet category stocks based on the POWR grades, holding a high ranking position and a B (Buy) grade.
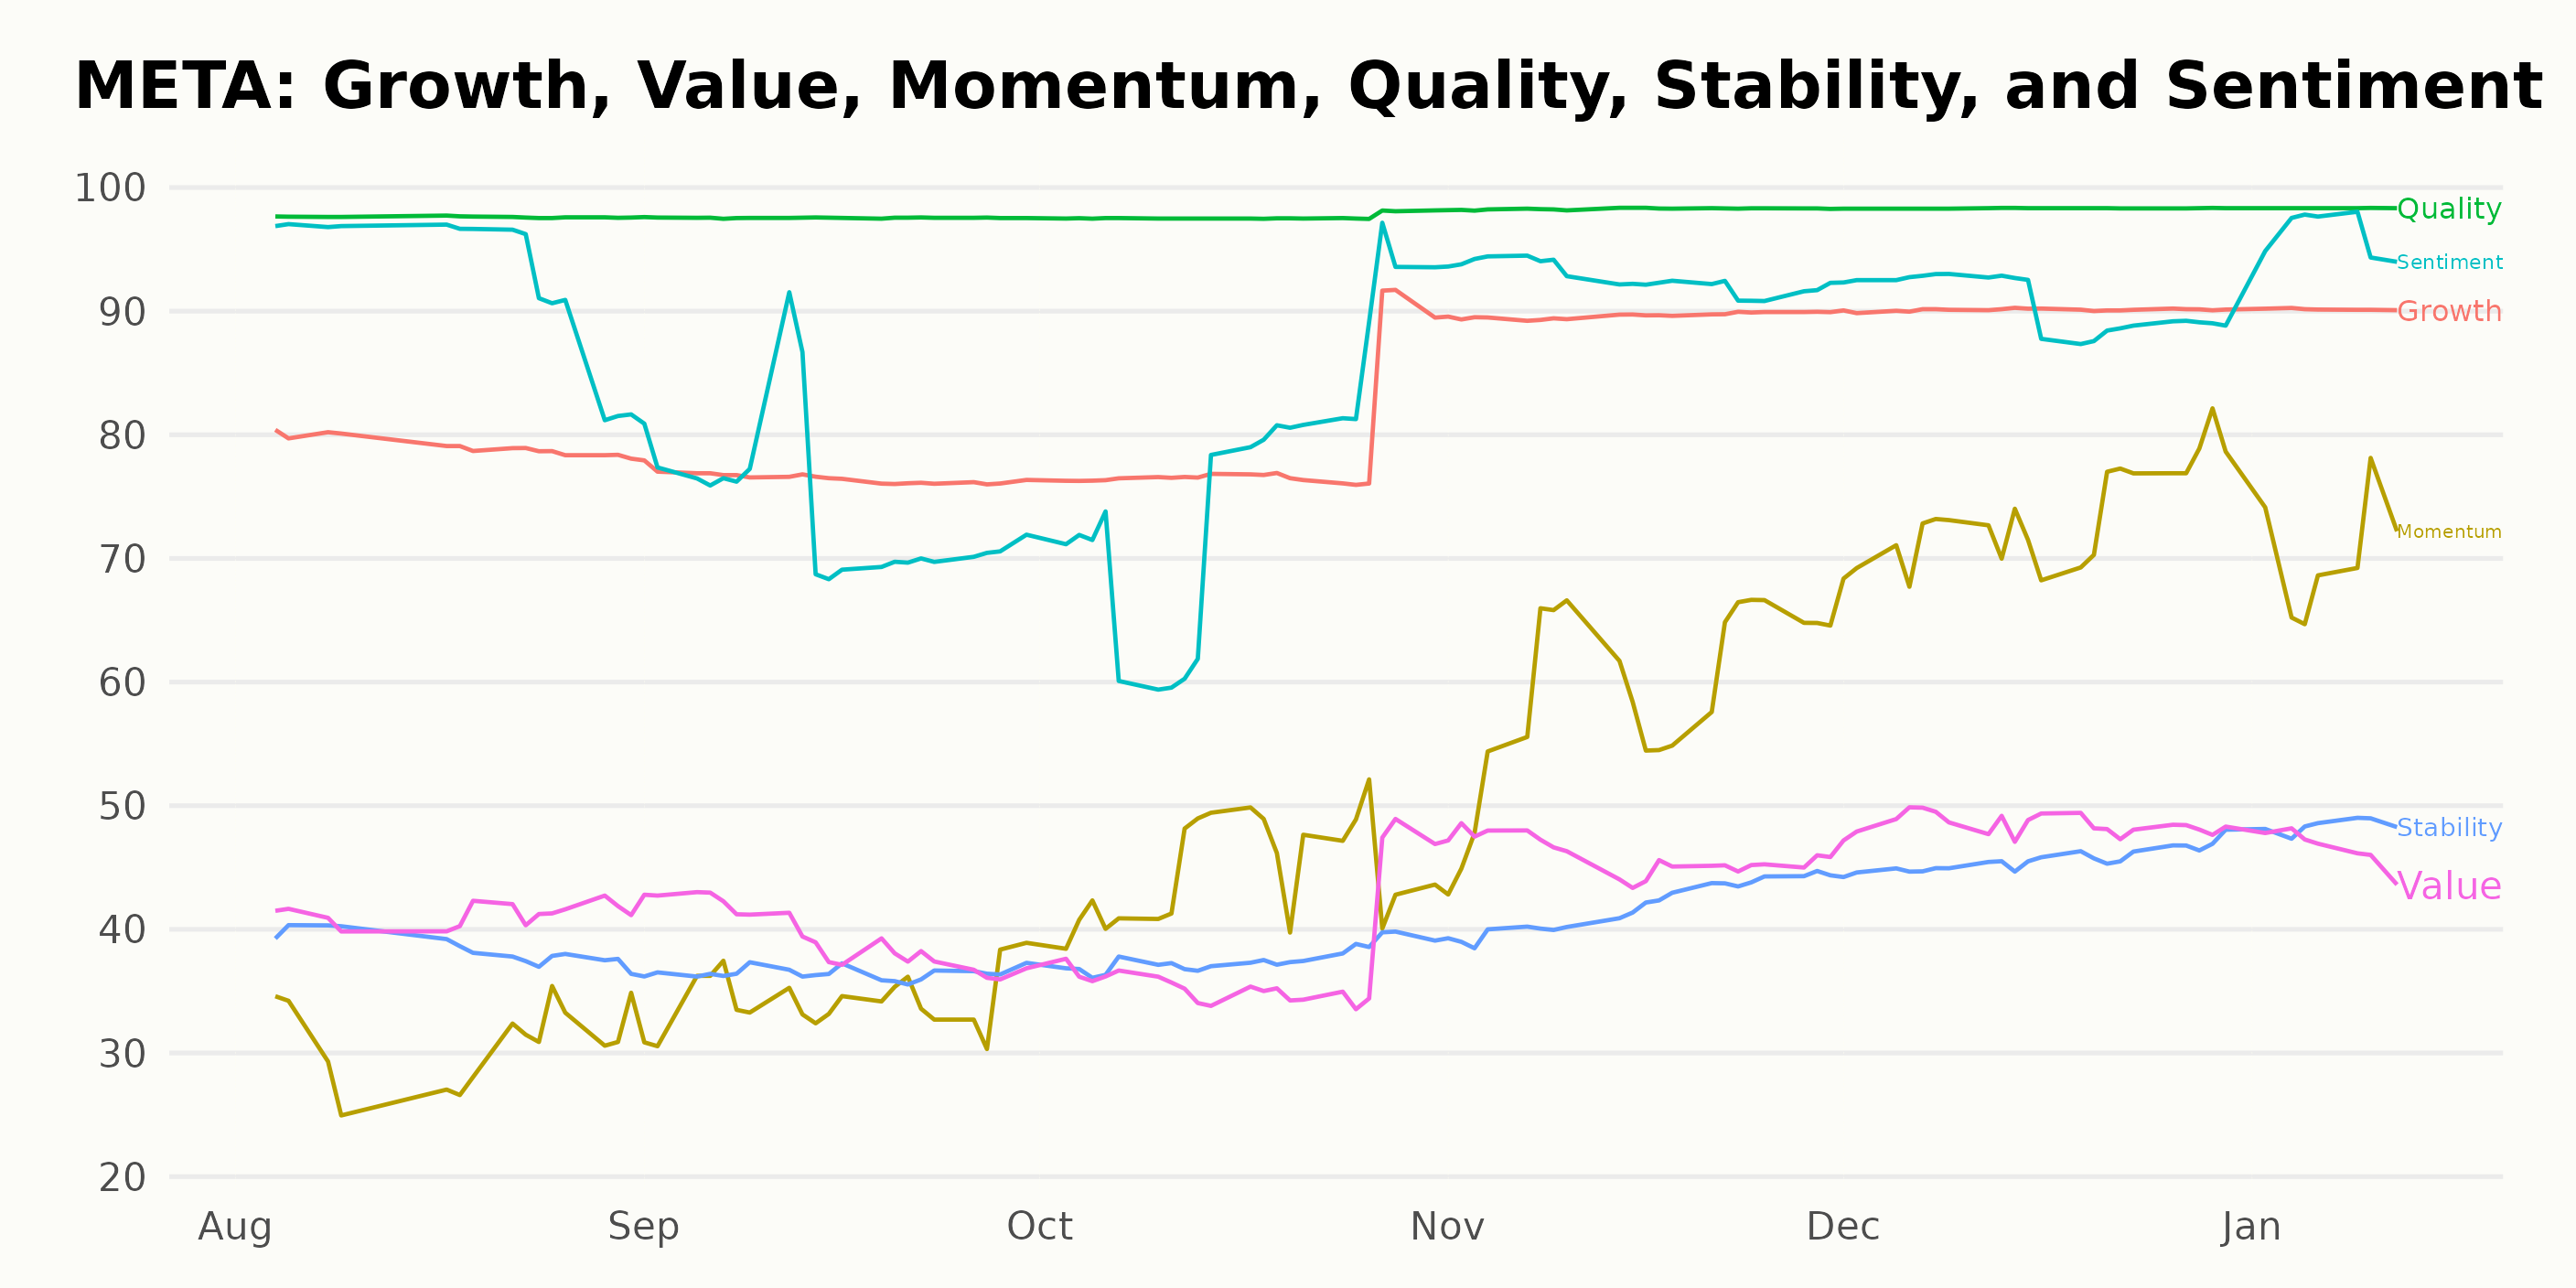
The POWR Ratings for META indicate several noteworthy trends along three dimensions: Quality, Sentiment, and Growth.
Quality: The Quality dimension consistently demonstrates the highest ratings for META over the analyzed period. Its value remained strong at 98 throughout every month from August 2023 to January 2024. This high rating signals a robust feature underlining META's performance.
Sentiment: Sentiment ranks as one of the top three dimensions for META. The data reveals some fluctuation in this dimension but overall shows a trend towards improvement. Values lowered slightly from 93 in August 2023 to 74 in September 2023 before gradually increasing from October 2023 (76), reaching its peak at 96 in January 2024.
Growth: Growth presents an upward trajectory from August 2023 to December 2023, with values starting at 79 in August, then dipping to 77 in September, and subsequently climbing to reach a plateau of 90 from November 2023 to January 2024. This suggests a promising growth pattern for META within the given time frame.
These trends reflect a favorable outlook for META, as judged by the Quality, Sentiment, and Growth dimensions of the POWR Ratings over this period.
How does Meta Platforms, Inc. (META) Stack Up Against its Peers?
While META has an overall B (Buy) rating, other stocks in the Internet sector that may be worth considering are Yelp Inc. (YELP), Alphabet Inc. (GOOGL), and Travelzoo (TZOO) - they have an overall rating of A (Strong Buy) or B (Buy). Click here to explore more Internet stocks.
What To Do Next?
Get your hands on this special report with 3 low priced companies with tremendous upside potential even in today’s volatile markets:
3 Stocks to DOUBLE This Year >
META shares were trading at $396.63 per share on Wednesday afternoon, down $3.43 (-0.86%). Year-to-date, META has gained 12.06%, versus a 2.49% rise in the benchmark S&P 500 index during the same period.
About the Author: Anushka Dutta

Anushka is an analyst whose interest in understanding the impact of broader economic changes on financial markets motivated her to pursue a career in investment research.
The post Meta (META): Analyzing Buy Signals Pre-Earnings Release appeared first on StockNews.com