

Civil infrastructure construction company Sterling Infrastructure (NASDAQ: STRL) announced better-than-expected revenue in Q2 CY2025, with sales up 5.4% year on year to $614.5 million. The company expects the full year’s revenue to be around $2.13 billion, close to analysts’ estimates. Its non-GAAP profit of $2.69 per share was 19.4% above analysts’ consensus estimates.
Is now the time to buy Sterling? Find out by accessing our full research report, it’s free.
Sterling (STRL) Q2 CY2025 Highlights:
- Revenue: $614.5 million vs analyst estimates of $554.4 million (5.4% year-on-year growth, 10.8% beat)
- Adjusted EPS: $2.69 vs analyst estimates of $2.25 (19.4% beat)
- Adjusted EBITDA: $125.6 million vs analyst estimates of $110.5 million (20.4% margin, 13.7% beat)
- The company lifted its revenue guidance for the full year to $2.13 billion at the midpoint from $2.1 billion, a 1.2% increase
- Management raised its full-year Adjusted EPS guidance to $9.34 at the midpoint, a 8% increase
- EBITDA guidance for the full year is $445.5 million at the midpoint, above analyst estimates of $422.5 million
- Operating Margin: 17%, up from 12.5% in the same quarter last year
- Free Cash Flow Margin: 11.7%, down from 15.8% in the same quarter last year
- Market Capitalization: $8 billion
On June 17th, Sterling announced that it had reached an agreement to acquire all of the assets of CEC Facilities Group LLC ("CEC"), and the transaction continues to progress towards closing.
Company Overview
Involved in the construction of a major highway, the Grand Parkway in Houston, TX, Sterling Infrastructure (NASDAQ: STRL) provides civil infrastructure construction.
Revenue Growth
Examining a company’s long-term performance can provide clues about its quality. Any business can put up a good quarter or two, but the best consistently grow over the long haul. Luckily, Sterling’s sales grew at a solid 9.9% compounded annual growth rate over the last five years. Its growth surpassed the average industrials company and shows its offerings resonate with customers, a great starting point for our analysis.
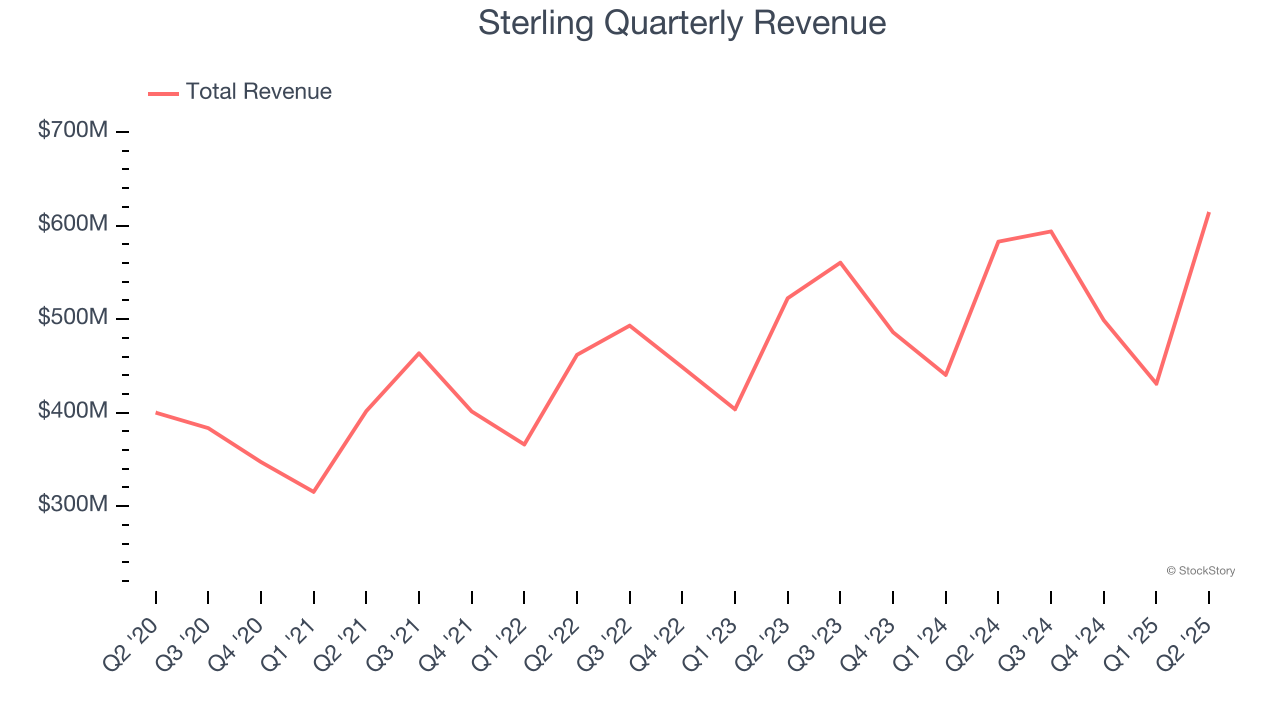
We at StockStory place the most emphasis on long-term growth, but within industrials, a half-decade historical view may miss cycles, industry trends, or a company capitalizing on catalysts such as a new contract win or a successful product line. Sterling’s recent performance shows its demand has slowed as its annualized revenue growth of 7% over the last two years was below its five-year trend. 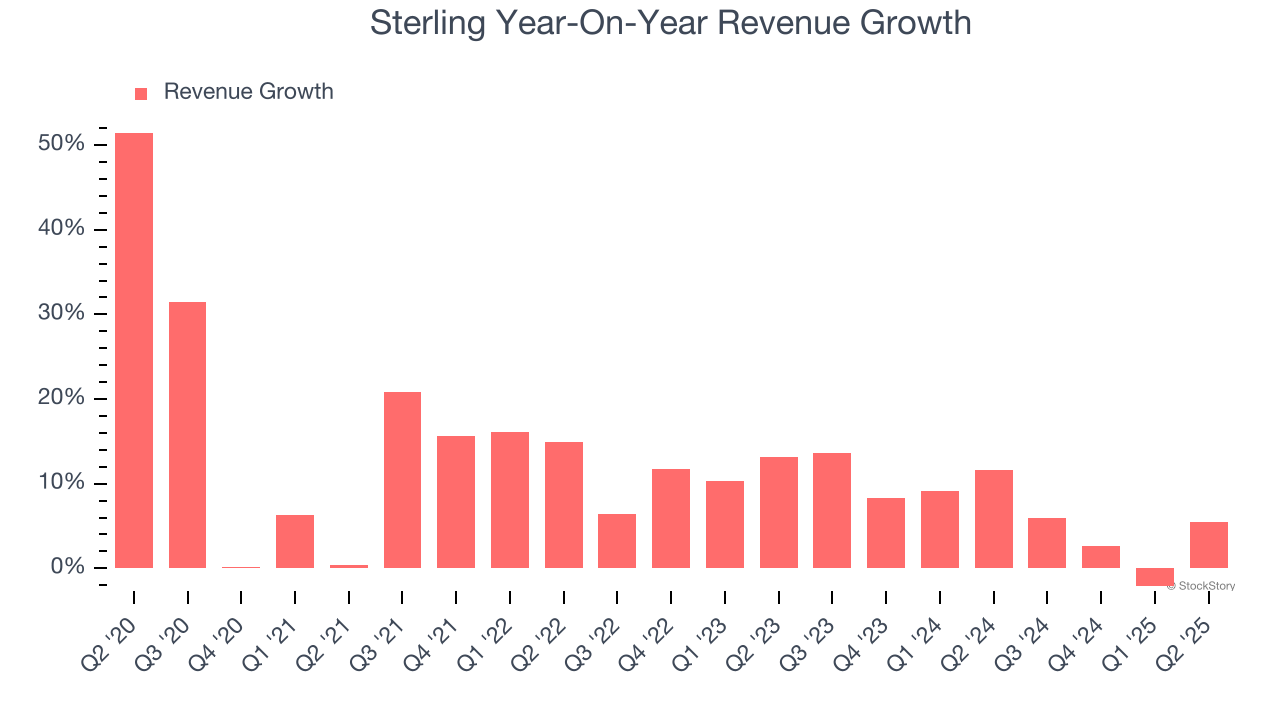
This quarter, Sterling reported year-on-year revenue growth of 5.4%, and its $614.5 million of revenue exceeded Wall Street’s estimates by 10.8%.
Looking ahead, sell-side analysts expect revenue to grow 7.2% over the next 12 months, similar to its two-year rate. This projection doesn't excite us and suggests its newer products and services will not catalyze better top-line performance yet. At least the company is tracking well in other measures of financial health.
Software is eating the world and there is virtually no industry left that has been untouched by it. That drives increasing demand for tools helping software developers do their jobs, whether it be monitoring critical cloud infrastructure, integrating audio and video functionality, or ensuring smooth content streaming. Click here to access a free report on our 3 favorite stocks to play this generational megatrend.
Operating Margin
Sterling has managed its cost base well over the last five years. It demonstrated solid profitability for an industrials business, producing an average operating margin of 10.4%. This result was particularly impressive because of its low gross margin, which is mostly a factor of what it sells and takes huge shifts to move meaningfully. Companies have more control over their operating margins, and it’s a show of well-managed operations if they’re high when gross margins are low.
Analyzing the trend in its profitability, Sterling’s operating margin rose by 7.2 percentage points over the last five years, as its sales growth gave it immense operating leverage.
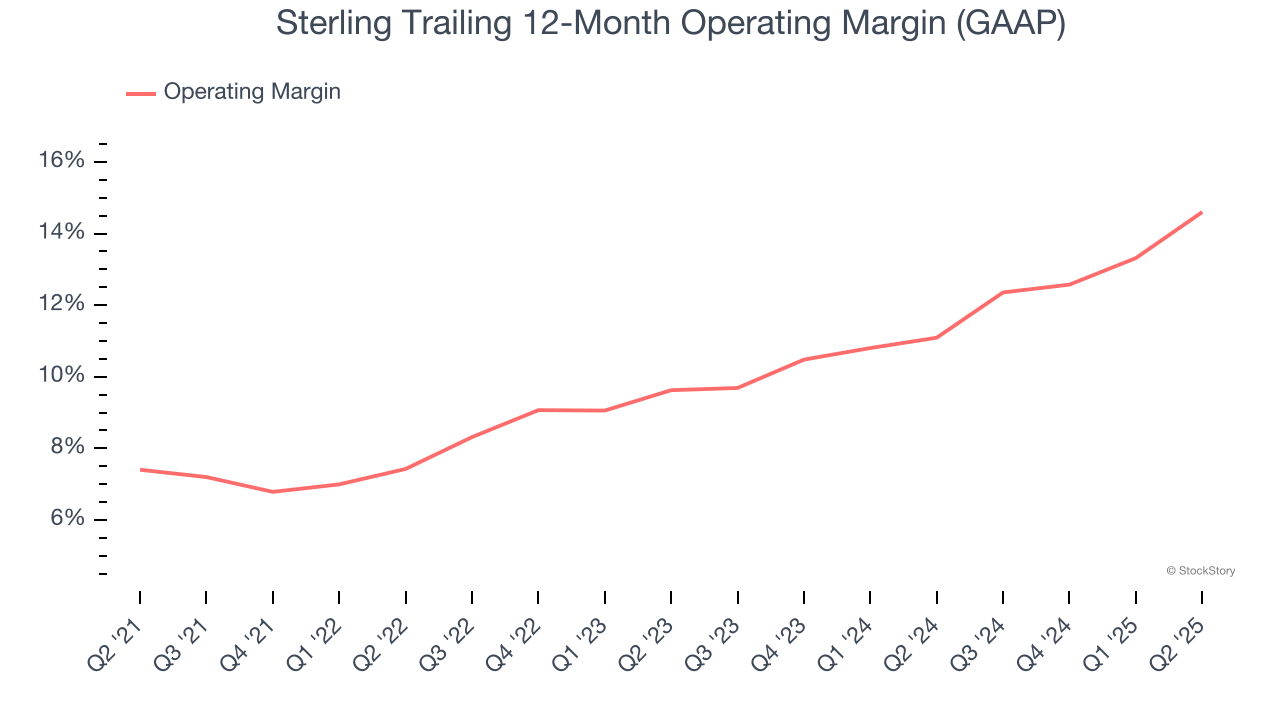
In Q2, Sterling generated an operating margin profit margin of 17%, up 4.5 percentage points year on year. The increase was encouraging, and because its operating margin rose more than its gross margin, we can infer it was more efficient with expenses such as marketing, R&D, and administrative overhead.
Earnings Per Share
Revenue trends explain a company’s historical growth, but the long-term change in earnings per share (EPS) points to the profitability of that growth – for example, a company could inflate its sales through excessive spending on advertising and promotions.
Sterling’s EPS grew at an astounding 41.6% compounded annual growth rate over the last five years, higher than its 9.9% annualized revenue growth. This tells us the company became more profitable on a per-share basis as it expanded.
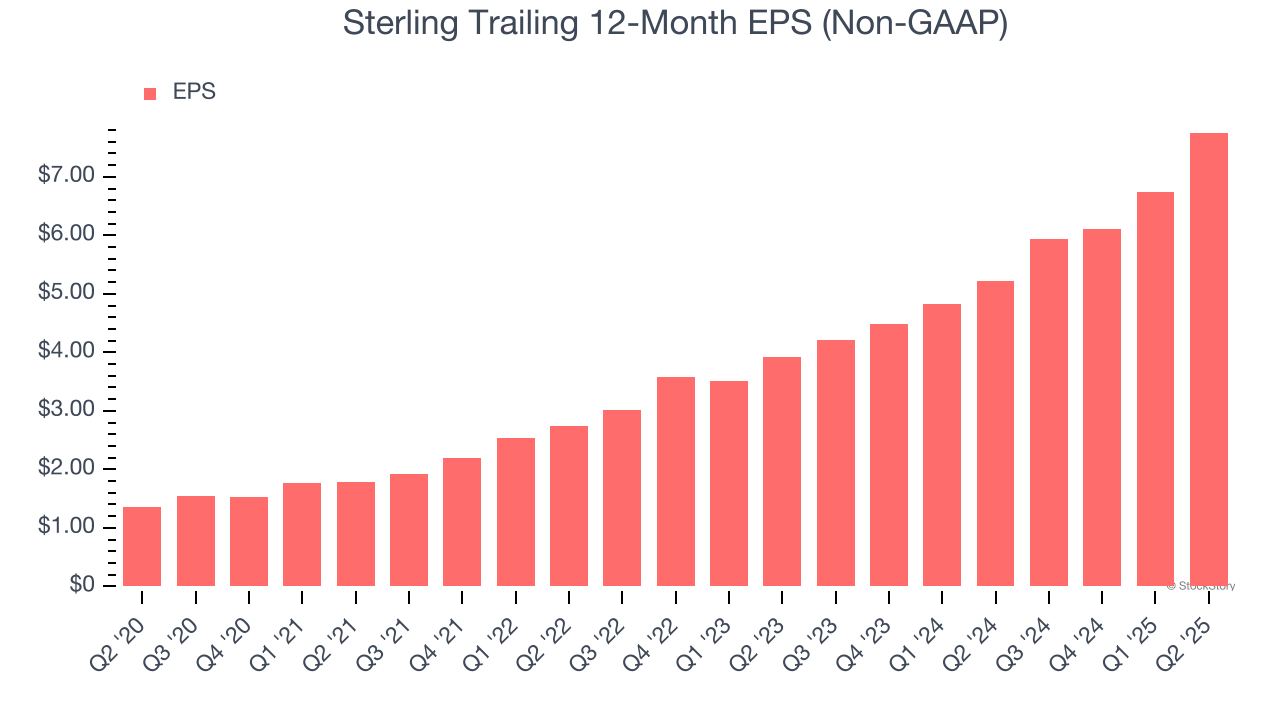
Diving into the nuances of Sterling’s earnings can give us a better understanding of its performance. As we mentioned earlier, Sterling’s operating margin expanded by 7.2 percentage points over the last five years. This was the most relevant factor (aside from the revenue impact) behind its higher earnings; interest expenses and taxes can also affect EPS but don’t tell us as much about a company’s fundamentals.
Like with revenue, we analyze EPS over a more recent period because it can provide insight into an emerging theme or development for the business.
For Sterling, its two-year annual EPS growth of 40.5% was lower than its five-year trend. We still think its growth was good and hope it can accelerate in the future.
In Q2, Sterling reported adjusted EPS at $2.69, up from $1.67 in the same quarter last year. This print easily cleared analysts’ estimates, and shareholders should be content with the results. Over the next 12 months, Wall Street expects Sterling’s full-year EPS of $7.76 to grow 13.8%.
Key Takeaways from Sterling’s Q2 Results
We were impressed that Sterling beat analysts’ revenue and EBITDA expectations this quarter. We were also excited its full-year guidance was raised. Zooming out, we think this was a solid print. The stock traded up 4.1% to $283.65 immediately following the results.
Sterling had an encouraging quarter, but one earnings result doesn’t necessarily make the stock a buy. Let’s see if this is a good investment. What happened in the latest quarter matters, but not as much as longer-term business quality and valuation, when deciding whether to invest in this stock. We cover that in our actionable full research report which you can read here, it’s free.


