

- Honeywell became a diversified giant through its growth by acquisition strategy
- Despite cyclical pressures and inflationary headwinds, the Company saw 12% growth in orders
- The Company executed $3.2 billion in stock buybacks
Competition and Strong Metrics
It competes with aerospace giants like Boeing (NYSE: BA) and is benefitting from the travel recovery in this epicenter industry. It also faces competition from other industrial giants outside of aerospace like 3M (NYSE: MMM) and Emerson Electric (NYSE: EMR). The Company is stable and profitable with a 2% dividend yield and over $11 billion in cash. Despite cyclical pressures and inflationary headwinds, the Company saw 12% growth in orders with $29.5 billion in backlog, setting up for a strong second half of the year. It has the DNA of a technology company combined with a mature and seasoned manufacturing and industrial giant. Investors seeking steady performance and diversification in multiple industries to mitigate recessionary pressures may want to take a look at Honeywell shares.
Diversified Industries
Honeywell became a diversified giant through its growth by acquisition strategy. However, the pace has been calculated, slow, and steady. The Company comprised of four reporting segments including Building Technologies, Performance Materials and Technologies, Safety and Productivity Solutions, and Aerospace being the largest. It’s also a Dow Jones Industrial Average (DJIA) component stock along with 3M.
Slow But Steady Earnings
On July 19, 2022, Honeywell released its fiscal second-quarter 2022 results for the quarter ending June 2022. The Company reported an earnings-per-share (EPS) profit of $2.10 excluding non-recurring items versus consensus analyst estimates for a profit of $2.07, a $0.07) beat. Revenues grew 1.6 % year-over-year (YoY) to $8.95 billion beating analyst estimates for $8.67 billion. The wind down of NASDAQ: NFLX">Russian operations and falling COVID-related mask sales had a (-3%) impact on earnings despite the 4% YoY organic sales growth led by commercial aviation, building products, productivity solutions, advanced sensing technologies, advanced materials and the connected software business. The Company expanded segment margin by 50 bps to stay ahead of the inflation curve. The Company executed $3.2 billion in stock buybacks to trim the float down to 685 million shares and is committed to an additional $4 billion in buybacks during 2022.
Flat Guidance Setting the Bar Low
Honeywell expected fiscal full-year 2022 EPS between $8.55 to $8.80 versus $8.69 consensus analyst estimates. Full-year revenues are expected between $35.5 billion to $36.1 billion versus the $35.97 billion analyst estimates. This could be a conservative estimate to set a low bar since the Company expects a strong second half recovery. Shares may have gotten ahead of themselves, so it would be prudent to wait for opportunistic pullback levels.
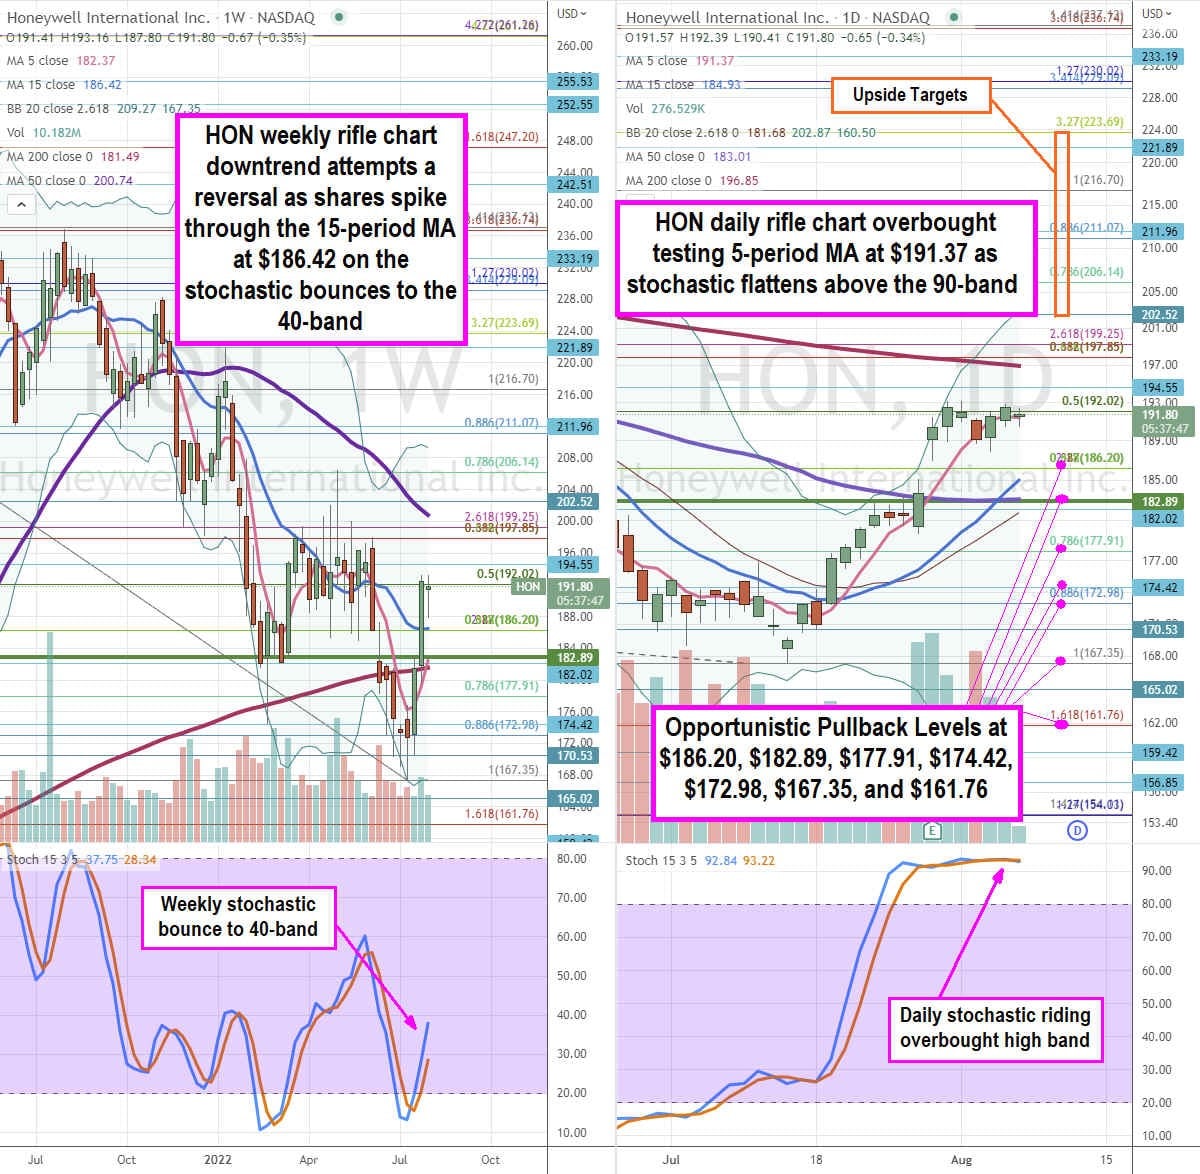
HON Entry Levels and Targets
Using the rifle charts on the weekly and daily time frames provides a precision view of the playing field for HON stock. The weekly rifle chart sharply reversed a breakout after rejecting hard off the $206.14 Fibonacci (fib) level. The weekly rifle chart breakdown bottomed at weekly lower Bollinger Bands (BBs) at $167.05 before staging a reversal on the weekly market structure low (MSL) buy trigger on the breakout above $182.89. The weekly 5-period moving average (MA) resistance turned back into a support as it slopes up towards the weekly 15-period MA at $186.42 as it attempts a breakout. The weekly 50-period MA resistance is falling at $200.74. The weekly upper BBs sit at $209.27. The weekly stochastic bounced up through the 20-band towards the 40-band indicating an oversold bounce. However, the daily rifle chart is overbought was the stochastic rides above the 90-band, which means its best not to chase shares. The daily uptrend has a rising 5-period MA support testing at $191.37 as the $192.02 fib has been keeping shares capped. The daily 200-period MA resistance sits at $196.85 and daily upper BBs sit at $202.87. Prudent investors can watch for the daily stochastic to peak and reverse to opportunistic pullback levels at the $186.20 fib, $182.89 weekly MSL trigger, $177.91 fib, $174.42, $167.35 fib/swing low, and the $161.79 fib. Upside targets range from the $202.52 level up towards the $223.69 fib level.


