
 Major airline carrier American Airlines Group (NASDAQ: AAL) has returned to profitability with record third-quarter revenues surpassing 2019 pre-pandemic levels. The whole airline industry has been NASDAQ: AAL">recovering as evidenced by the earnings releases from Delta Air Lines (NYSE: DAL), Southwest Airlines (NYSE: LUV), and United Airlines (NASDAQ: UAL). It’s also reflected in the surging demand for Boeing (NYSE: BA) airplanes. Incidentally, American Airlines has no MAX 7 or MAX 10 aircraft on order, which isolates it from any regulatory changes. American Airlines stands out as its flight schedule was more than 25% larger than its nearest competitor as measured by total departures. The metrics were impressive for the nation’s largest airline network averaging over 5,100 daily departures. It’s regional partners surpassed over half a million flights with an average load factor of 85.3%. Demand remains “very strong” for both domestic and short-haul international travel. Long-haul travel is expected to improve as travel restrictions get lifted around the world. The strong U.S. dollar is also making it very attractive for Americans looking to travel overseas despite inflationary pressures. Falling oil prices have also helped to bolster margins.
Hybrid Work Pumping Demand
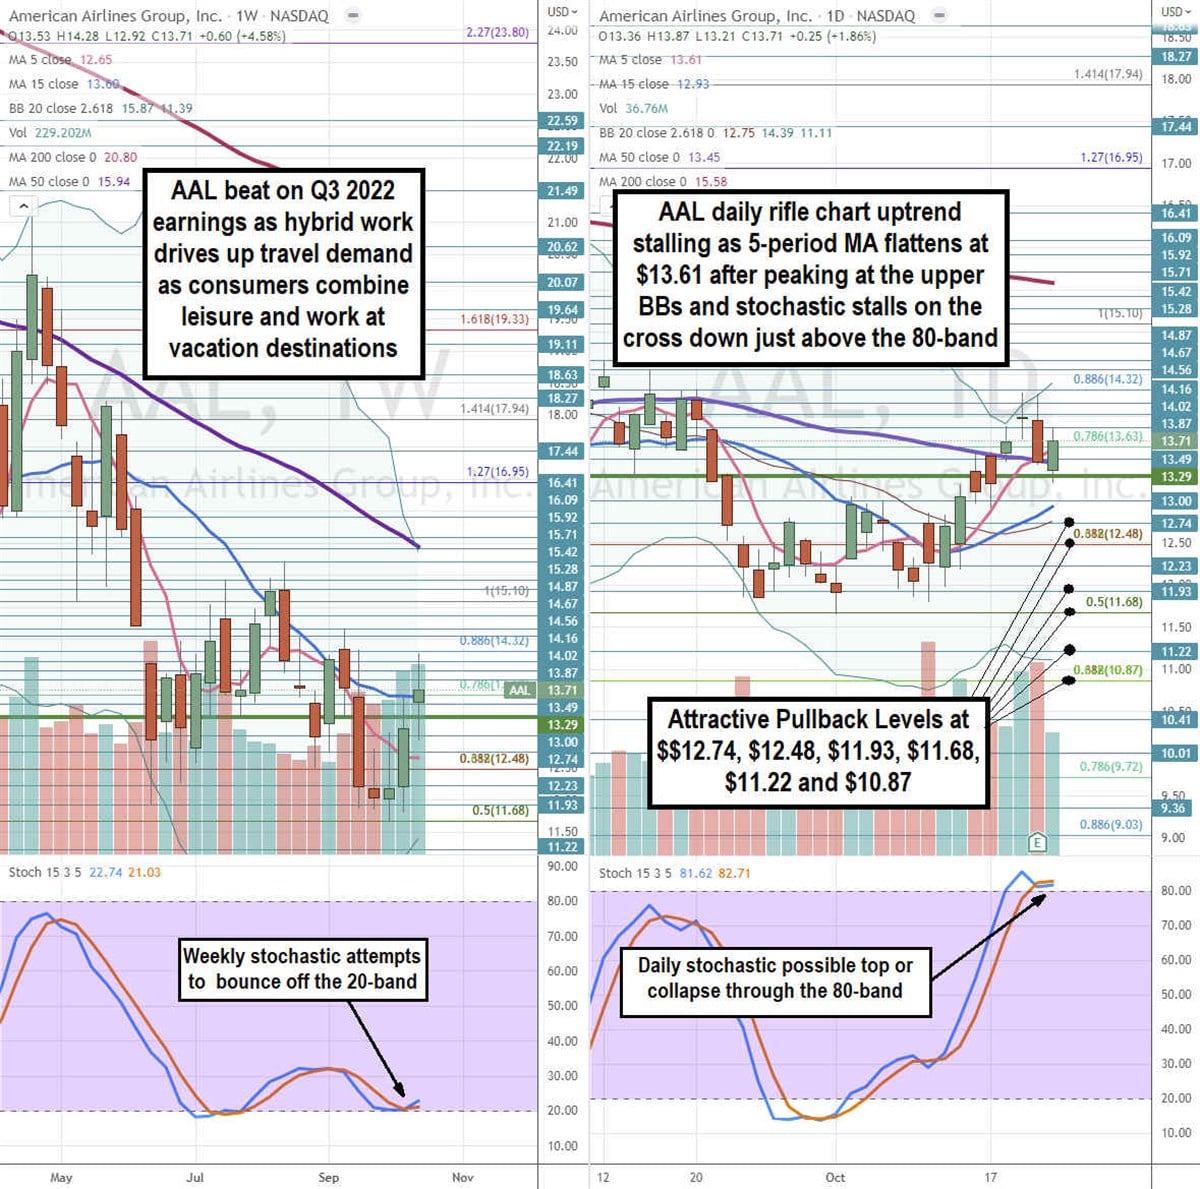
The Company has noted that the new pandemic spawned the normal of hybrid and remote work has resulted in a permanent lift in travel demand. Consumers are not restrained to travel by money but by time. Hybrid work has enabled consumers to combine both leisure travel with work since they aren’t restricted to an office. They are taking more short-haul excursions turning weekends into mini holidays which still getting work done. It also doesn’t hurt to be able to write off a piece of the leisure travel as a business expense. While capacity hasn’t returned to pre-pandemic levels, higher pricing is helping to offset this lacking metric.
Robust Rebound
On Oct. 22, 2022, American Airlines released its fiscal third-quarter 2022 results for the quarter ending September 2022. The Company reported an earnings-per-share (EPS) profit of $0.69 excluding non-recurring items versus consensus analyst estimates for a profit of $0.56, a $0.13 beat. Revenues grew 50.1% year-over-year (YoY) to $13.46 billion meeting analyst estimates. This reflects the post-pandemic off-the-chart demand generating all-time highs in the summer months. The Company plans to pay down $15 million of total debt by the end of 2025. American Airlines CEO Robert Isom commented, “The American Airlines team continues to deliver on our goals of running a reliable operation and returning to profitability. Demand remains strong, and it’s clear that customers in the U.S. and other parts of the world continue to value air travel and the ability to reconnect post-pandemic. American has the youngest, most fuel-efficient fleet among U.S. network carriers, and we are well-positioned for the future because of the incredible efforts of our team.”
Good Times Ahead
American Airlines expects fiscal Q4 2022 EPS to come in between $0.50 to $0.70 versus $0.27 consensus analyst estimates. The Company expects Q4 2022 revenues to rise 11% to 13% over 2019 to $12.56 billion to $12.78 billion beating consensus analyst estimates of $12.61 billion.
Recent News and Events
On Feb. 24, 2022, Russian forces invaded Ukraine and prompted many events impacting United Airlines and the airline industry. On Feb. 28, 2022, the European Union (EU) announced that airspace will be closed to every Russian plane including private planes. Crude oil prices surged to 13-year highs above $130 per barrel in March impacting fuel prices. On March 1, 2022, The U.S. government banned Russian flights from American airspace following up on actions
Here’s What the Charts Say
Using the rifle charts on the weekly and daily time frames provides a precise view of the playing field for AAL stock. The weekly rifle chart downtrend bottomed out at the $11.68 Fibonacci (fib) level. The weekly rifle chart breakdown has stalled as the weekly 5-period moving average (MA) went flat at $12.65 followed by the falling weekly 15-period MA at $13.60. Shares spiked on earnings to enable the weekly stochastic to attempt to bounce off the 20-band. The weekly 50-period MA overlaps the weekly upper BBs at $15.87 and weekly lower BBs are rising at $11.39. The weekly market structure low (MSL) buy triggered on a breakout above $13.29. The daily rifle chart uptrend is starting to stall as the daily 5-period MA slows at $13.61 and daily 50-period MA at $13.45. The daily 15-period MA is still rising at $12.93 support. The daily stochastic peaked and held above the 80-band temporarily as it decides to either cross back up or form a mini inverse pup plunge back under the 80-band. Attractive pullback levels sit at the $12.74, $12.48 fib, $11.93, $11.68 fib, $11.22, and $10.87 fib level.


