

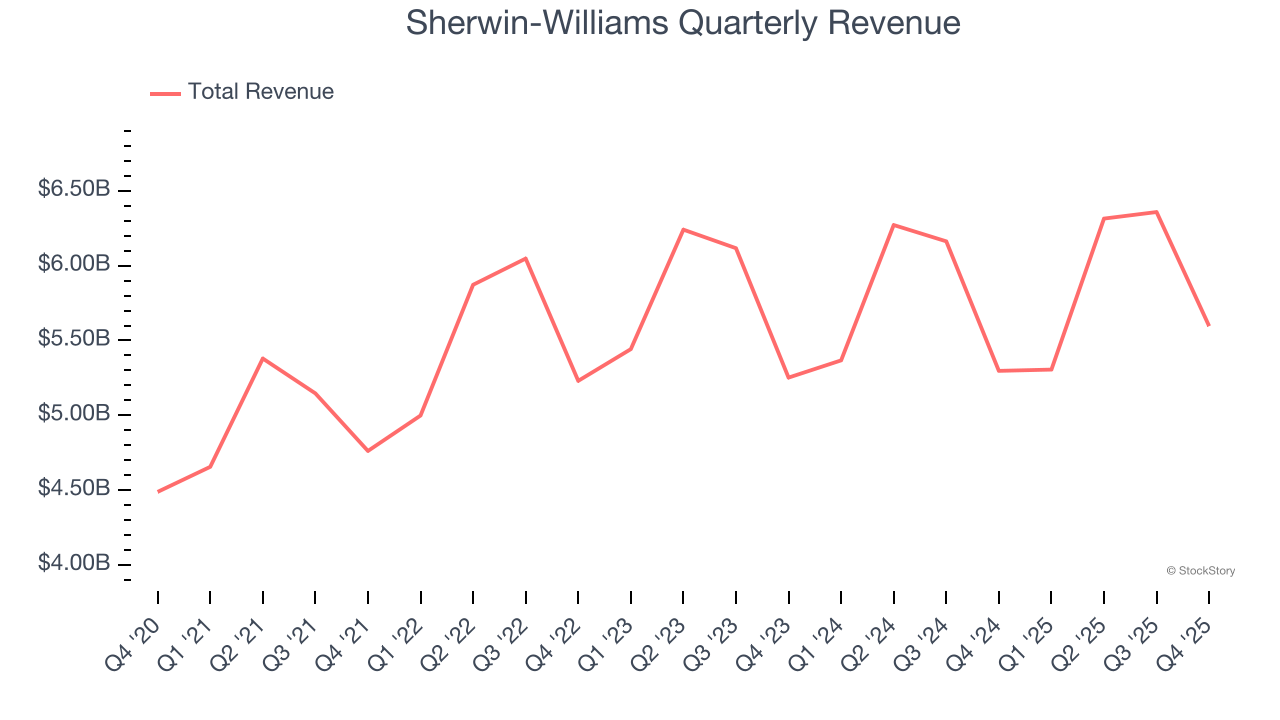
Paint and coating manufacturer Sherwin-Williams (NYSE: SHW) reported Q4 CY2025 results beating Wall Street’s revenue expectations, with sales up 5.6% year on year to $5.60 billion. Its non-GAAP profit of $2.23 per share was 3.1% above analysts’ consensus estimates.
Is now the time to buy Sherwin-Williams? Find out by accessing our full research report, it’s free.
Sherwin-Williams (SHW) Q4 CY2025 Highlights:
- Revenue: $5.60 billion vs analyst estimates of $5.55 billion (5.6% year-on-year growth, 0.8% beat)
- Adjusted EPS: $2.23 vs analyst estimates of $2.16 (3.1% beat)
- Adjusted EBITDA: $993.1 million vs analyst estimates of $927.3 million (17.7% margin, 7.1% beat)
- Adjusted EPS guidance for the upcoming financial year 2026 is $11.70 at the midpoint, missing analyst estimates by 5.5%
- Operating Margin: 13.9%, in line with the same quarter last year
- Market Capitalization: $86.16 billion
"Sherwin-Williams delivered strong fourth quarter results driven by solid core performance amid continued demand choppiness, and inclusive of the first full quarter of the Suvinil acquisition," said Chair, President and Chief Executive Officer, Heidi G. Petz.
Company Overview
Widely known for its success in the paint industry, Sherwin-Williams (NYSE: SHW) is a manufacturer of paints, coatings, and related products.
Revenue Growth
A company’s long-term sales performance can indicate its overall quality. Even a bad business can shine for one or two quarters, but a top-tier one grows for years. Regrettably, Sherwin-Williams’s sales grew at a tepid 5.1% compounded annual growth rate over the last five years. This was below our standard for the industrials sector and is a poor baseline for our analysis.
Long-term growth is the most important, but within industrials, a half-decade historical view may miss new industry trends or demand cycles. Sherwin-Williams’s recent performance shows its demand has slowed as its annualized revenue growth of 1.1% over the last two years was below its five-year trend. 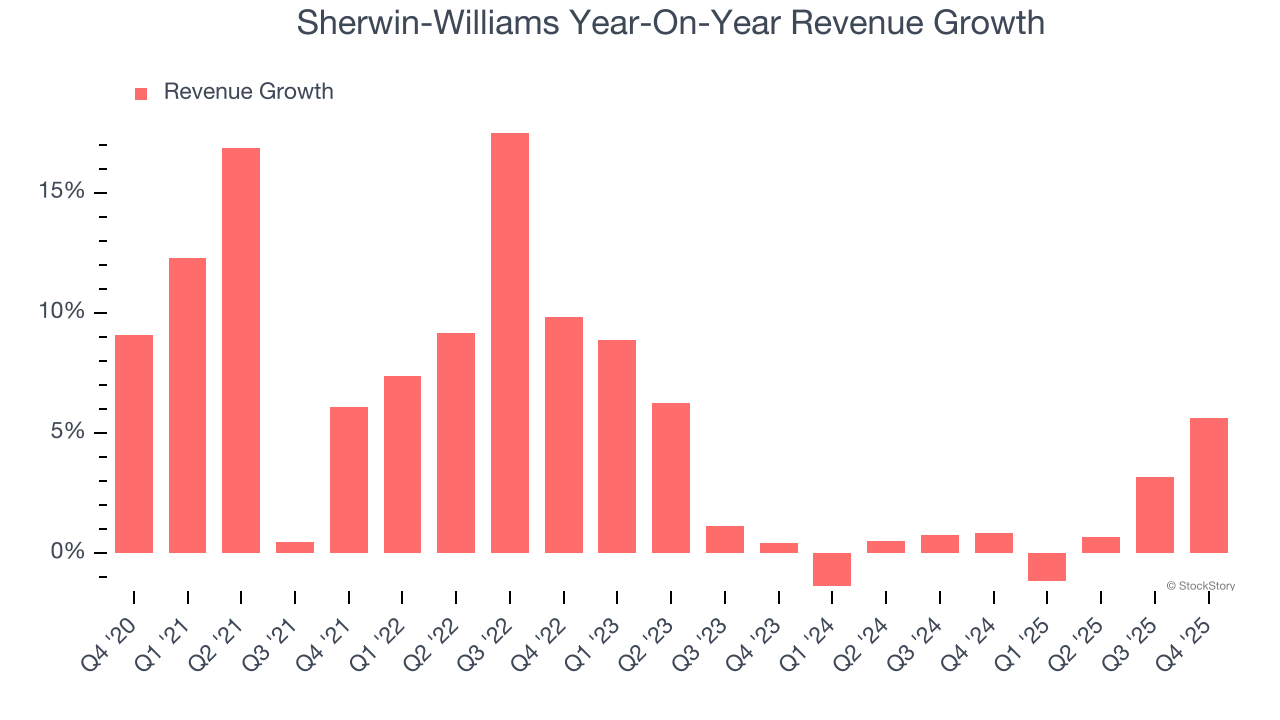
This quarter, Sherwin-Williams reported year-on-year revenue growth of 5.6%, and its $5.60 billion of revenue exceeded Wall Street’s estimates by 0.8%.
Looking ahead, sell-side analysts expect revenue to grow 4.5% over the next 12 months. Although this projection implies its newer products and services will fuel better top-line performance, it is still below average for the sector.
The 1999 book Gorilla Game predicted Microsoft and Apple would dominate tech before it happened. Its thesis? Identify the platform winners early. Today, enterprise software companies embedding generative AI are becoming the new gorillas. a profitable, fast-growing enterprise software stock that is already riding the automation wave and looking to catch the generative AI next.
Operating Margin
Operating margin is a key measure of profitability. Think of it as net income - the bottom line - excluding the impact of taxes and interest on debt, which are less connected to business fundamentals.
Sherwin-Williams has been an efficient company over the last five years. It was one of the more profitable businesses in the industrials sector, boasting an average operating margin of 14.9%. This result isn’t surprising as its high gross margin gives it a favorable starting point.
Analyzing the trend in its profitability, Sherwin-Williams’s operating margin rose by 3.2 percentage points over the last five years, as its sales growth gave it operating leverage.
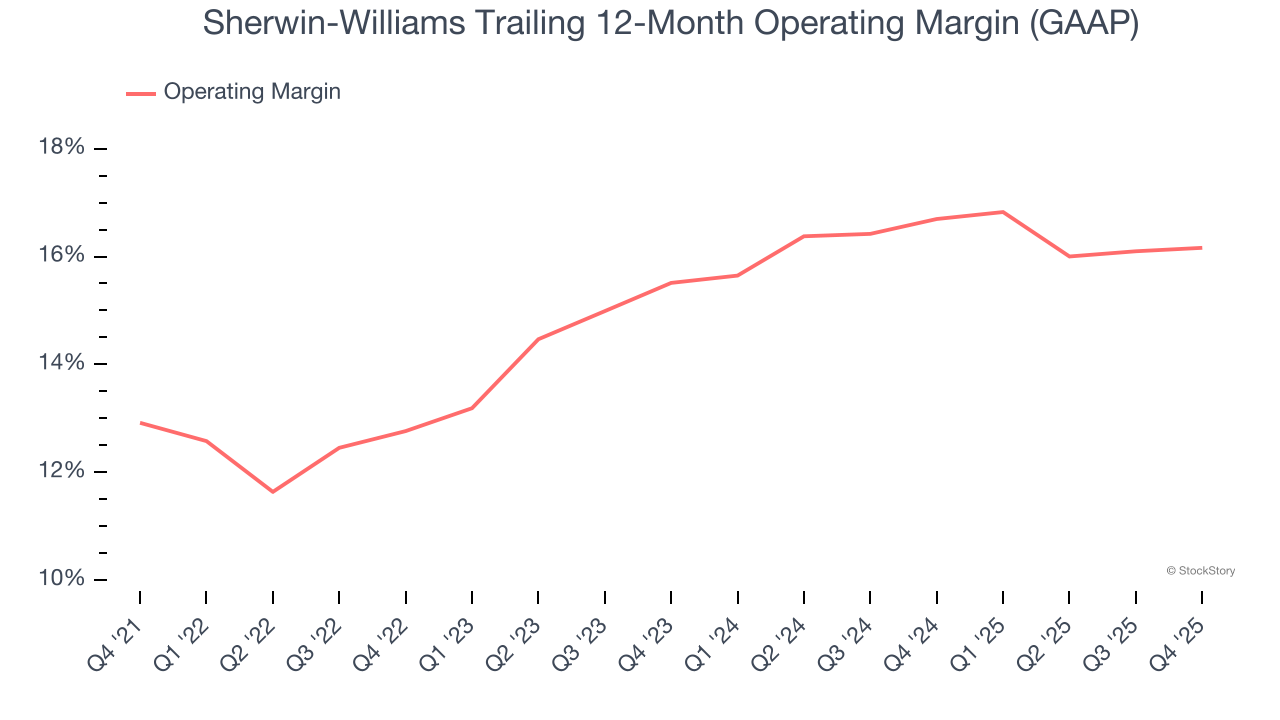
This quarter, Sherwin-Williams generated an operating margin profit margin of 13.9%, in line with the same quarter last year. This indicates the company’s cost structure has recently been stable.
Earnings Per Share
We track the long-term change in earnings per share (EPS) for the same reason as long-term revenue growth. Compared to revenue, however, EPS highlights whether a company’s growth is profitable.
Sherwin-Williams’s unimpressive 6.9% annual EPS growth over the last five years aligns with its revenue performance. On the bright side, this tells us its incremental sales were profitable.
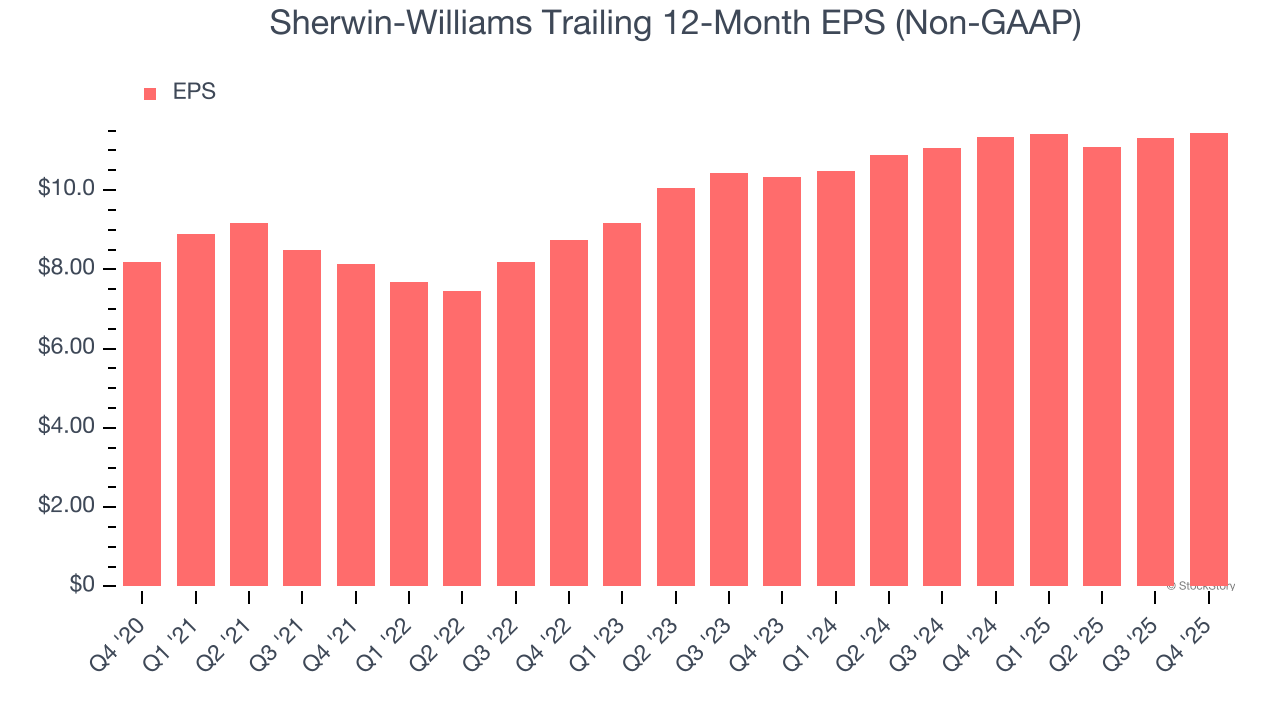
Like with revenue, we analyze EPS over a shorter period to see if we are missing a change in the business.
Although it wasn’t great, Sherwin-Williams’s two-year annual EPS growth of 5.2% topped its 1.1% two-year revenue growth.
We can take a deeper look into Sherwin-Williams’s earnings to better understand the drivers of its performance. While we mentioned earlier that Sherwin-Williams’s operating margin was flat this quarter, a two-year view shows its margin has expandedwhile its share count has shrunk 3.2%. These are positive signs for shareholders because improving profitability and share buybacks turbocharge EPS growth relative to revenue growth. 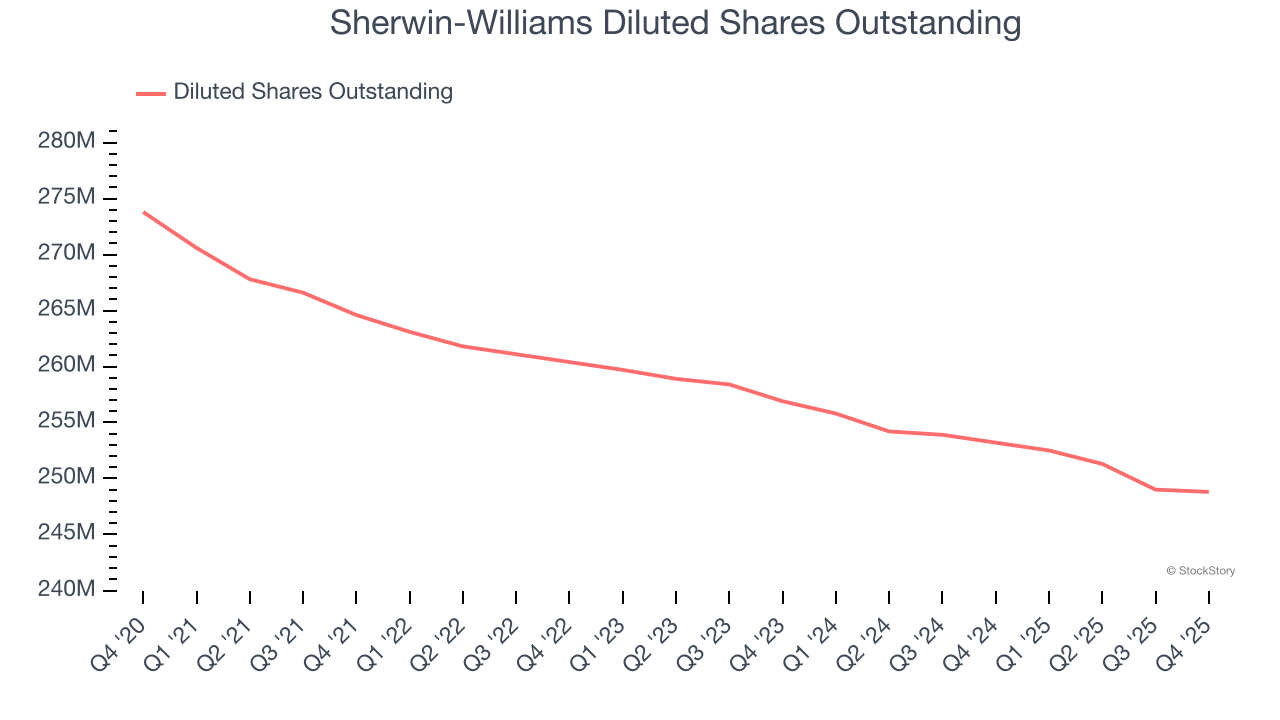
In Q4, Sherwin-Williams reported adjusted EPS of $2.23, up from $2.09 in the same quarter last year. This print beat analysts’ estimates by 3.1%. Over the next 12 months, Wall Street expects Sherwin-Williams’s full-year EPS of $11.45 to grow 7%.
Key Takeaways from Sherwin-Williams’s Q4 Results
We enjoyed seeing Sherwin-Williams beat analysts’ EBITDA expectations this quarter. We were also happy its revenue narrowly outperformed Wall Street’s estimates. On the other hand, its full-year EPS guidance missed, and this is weighing on shares. Zooming out, we think this was a mixed quarter. Investors were likely hoping for more, and shares traded down 1.4% to $344.88 immediately after reporting.
Big picture, is Sherwin-Williams a buy here and now? The latest quarter does matter, but not nearly as much as longer-term fundamentals and valuation, when deciding if the stock is a buy. We cover that in our actionable full research report which you can read here (it’s free).


