
Freight transportation company Norfolk Southern (NYSE: NSC) fell short of the markets revenue expectations in Q4 CY2025, with sales falling 1.7% year on year to $2.97 billion. Its GAAP profit of $2.87 per share was 3.4% above analysts’ consensus estimates.
Is now the time to buy Norfolk Southern? Find out by accessing our full research report, it’s free.
Norfolk Southern (NSC) Q4 CY2025 Highlights:
- Revenue: $2.97 billion vs analyst estimates of $3.01 billion (1.7% year-on-year decline, 1.1% miss)
- EPS (GAAP): $2.87 vs analyst estimates of $2.77 (3.4% beat)
- Adjusted EBITDA: $1.29 billion vs analyst estimates of $1.34 billion (43.4% margin, 3.7% miss)
- Operating Margin: 31.5%, down from 37.4% in the same quarter last year
- Free Cash Flow Margin: 11.2%, up from 9.1% in the same quarter last year
- Market Capitalization: $63.83 billion
Company Overview
Starting with a single route from Virginia to North Carolina, Norfolk Southern (NYSE: NSC) is a freight transportation company operating a major railroad network across the eastern United States.
Revenue Growth
Examining a company’s long-term performance can provide clues about its quality. Any business can put up a good quarter or two, but the best consistently grow over the long haul. Unfortunately, Norfolk Southern’s 4.5% annualized revenue growth over the last five years was sluggish. This was below our standard for the industrials sector and is a rough starting point for our analysis.
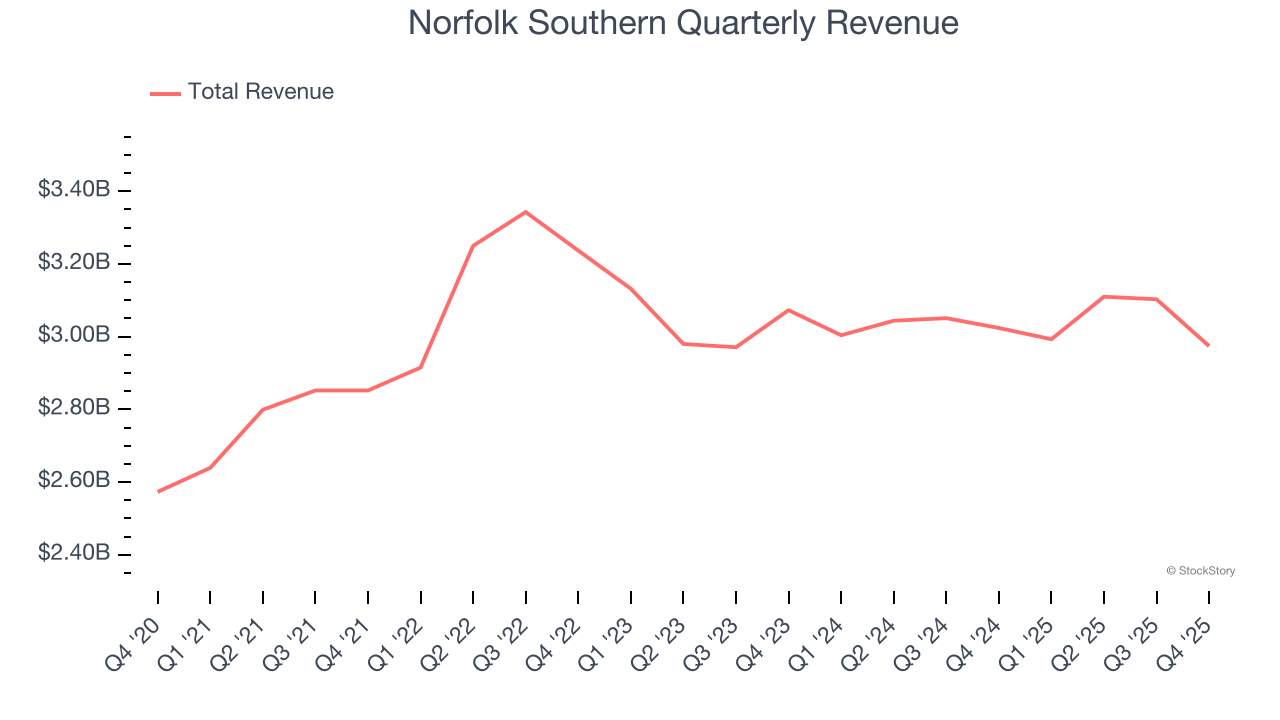
Long-term growth is the most important, but within industrials, a half-decade historical view may miss new industry trends or demand cycles. Norfolk Southern’s recent performance shows its demand has slowed as its revenue was flat over the last two years. We also note many other Rail Transportation businesses have faced declining sales because of cyclical headwinds. While Norfolk Southern’s growth wasn’t the best, it did do better than its peers. 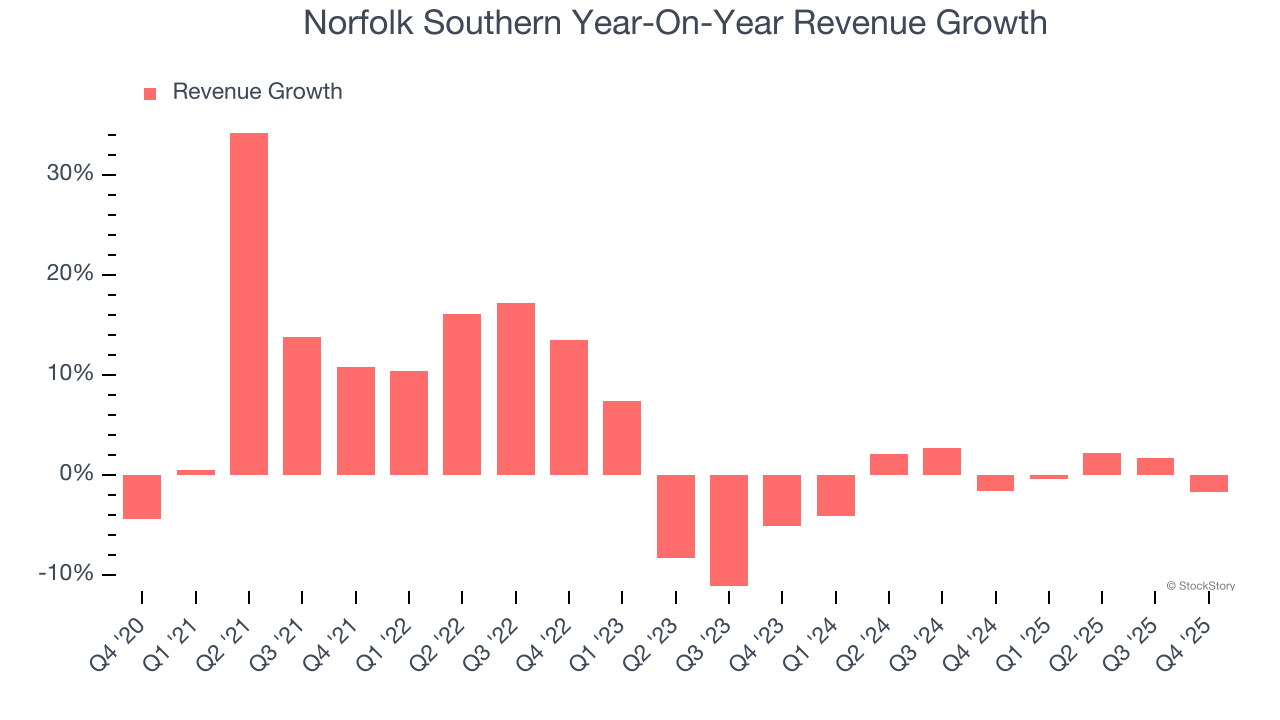
This quarter, Norfolk Southern missed Wall Street’s estimates and reported a rather uninspiring 1.7% year-on-year revenue decline, generating $2.97 billion of revenue.
Looking ahead, sell-side analysts expect revenue to grow 2.9% over the next 12 months. Although this projection implies its newer products and services will fuel better top-line performance, it is still below average for the sector.
Software is eating the world and there is virtually no industry left that has been untouched by it. That drives increasing demand for tools helping software developers do their jobs, whether it be monitoring critical cloud infrastructure, integrating audio and video functionality, or ensuring smooth content streaming. Click here to access a free report on our 3 favorite stocks to play this generational megatrend.
Operating Margin
Norfolk Southern has been a well-oiled machine over the last five years. It demonstrated elite profitability for an industrials business, boasting an average operating margin of 34%. This result isn’t surprising as its high gross margin gives it a favorable starting point.
Analyzing the trend in its profitability, Norfolk Southern’s operating margin decreased by 4.1 percentage points over the last five years. Many Rail Transportation companies also saw their margins fall (along with revenue, as mentioned above) because the cycle turned in the wrong direction. We hope Norfolk Southern can emerge from this a stronger company, as the silver lining of a downturn is that market share can be won and efficiencies found.
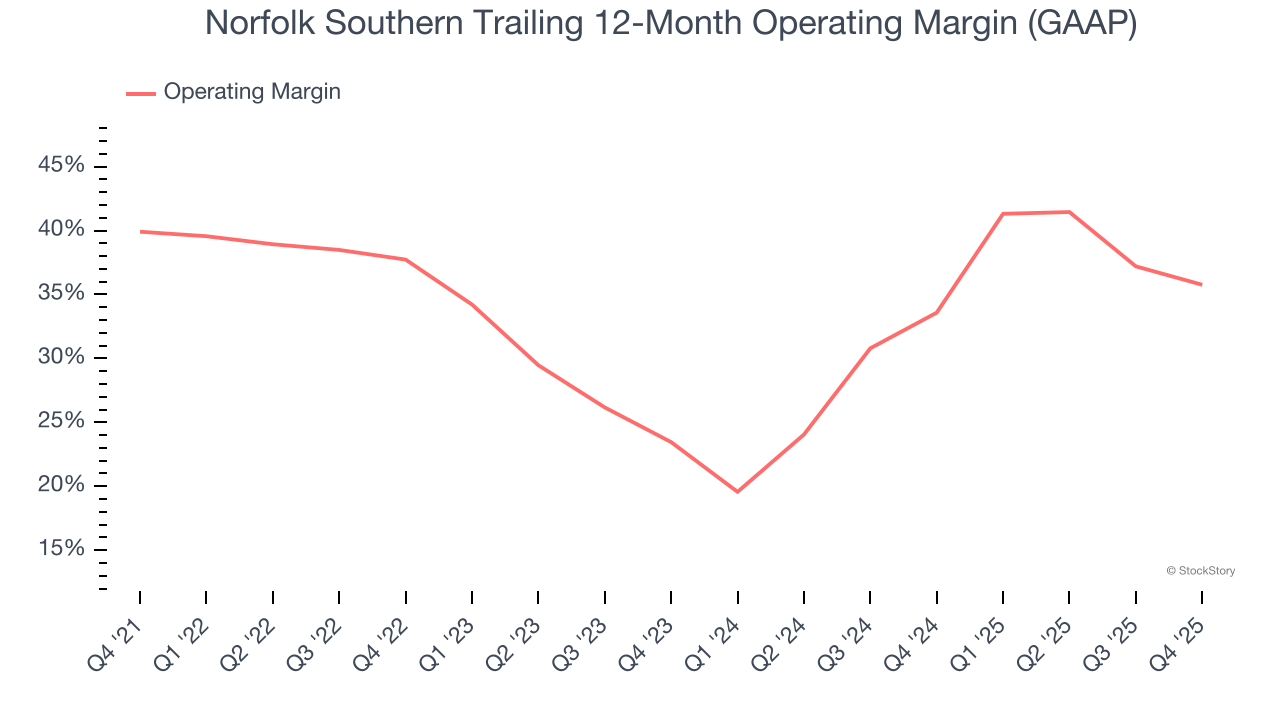
This quarter, Norfolk Southern generated an operating margin profit margin of 31.5%, down 5.9 percentage points year on year. Since Norfolk Southern’s operating margin decreased more than its gross margin, we can assume it was less efficient because expenses such as marketing, R&D, and administrative overhead increased.
Earnings Per Share
We track the long-term change in earnings per share (EPS) for the same reason as long-term revenue growth. Compared to revenue, however, EPS highlights whether a company’s growth is profitable.
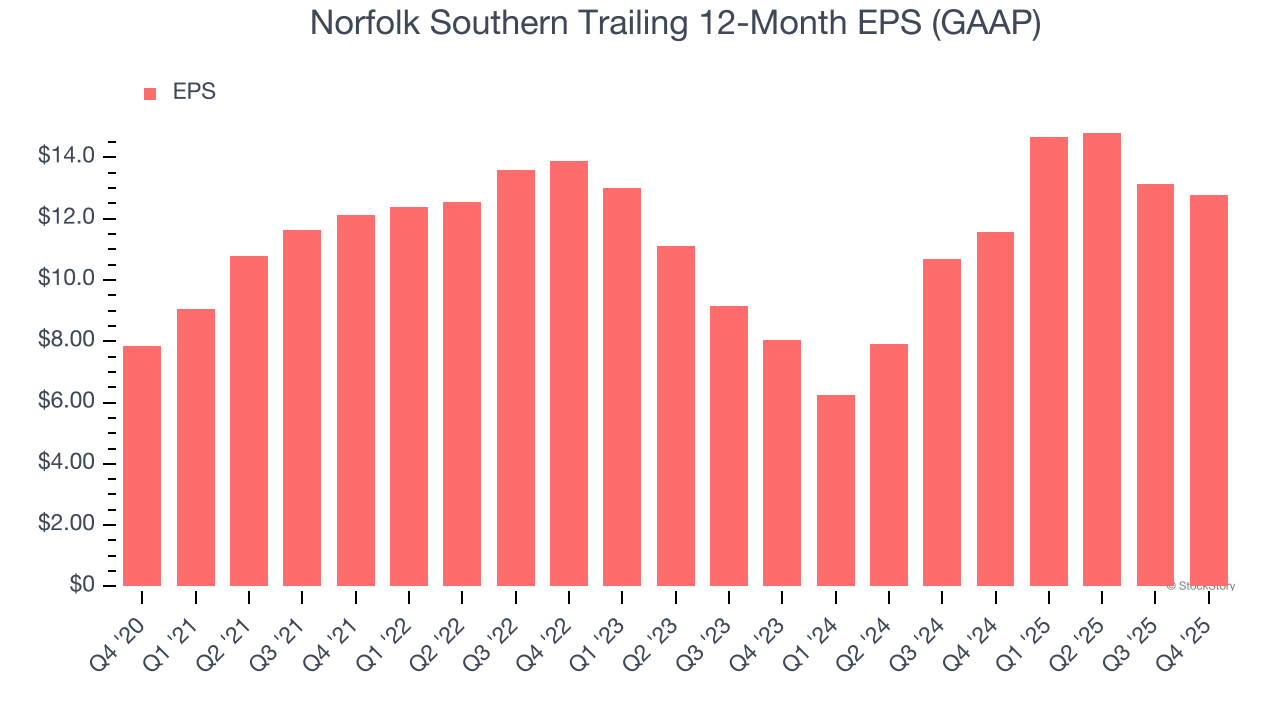
Norfolk Southern’s EPS grew at a solid 10.2% compounded annual growth rate over the last five years, higher than its 4.5% annualized revenue growth. However, this alone doesn’t tell us much about its business quality because its operating margin didn’t improve.
Diving into Norfolk Southern’s quality of earnings can give us a better understanding of its performance. A five-year view shows that Norfolk Southern has repurchased its stock, shrinking its share count by 11.7%. This tells us its EPS outperformed its revenue not because of increased operational efficiency but financial engineering, as buybacks boost per share earnings. 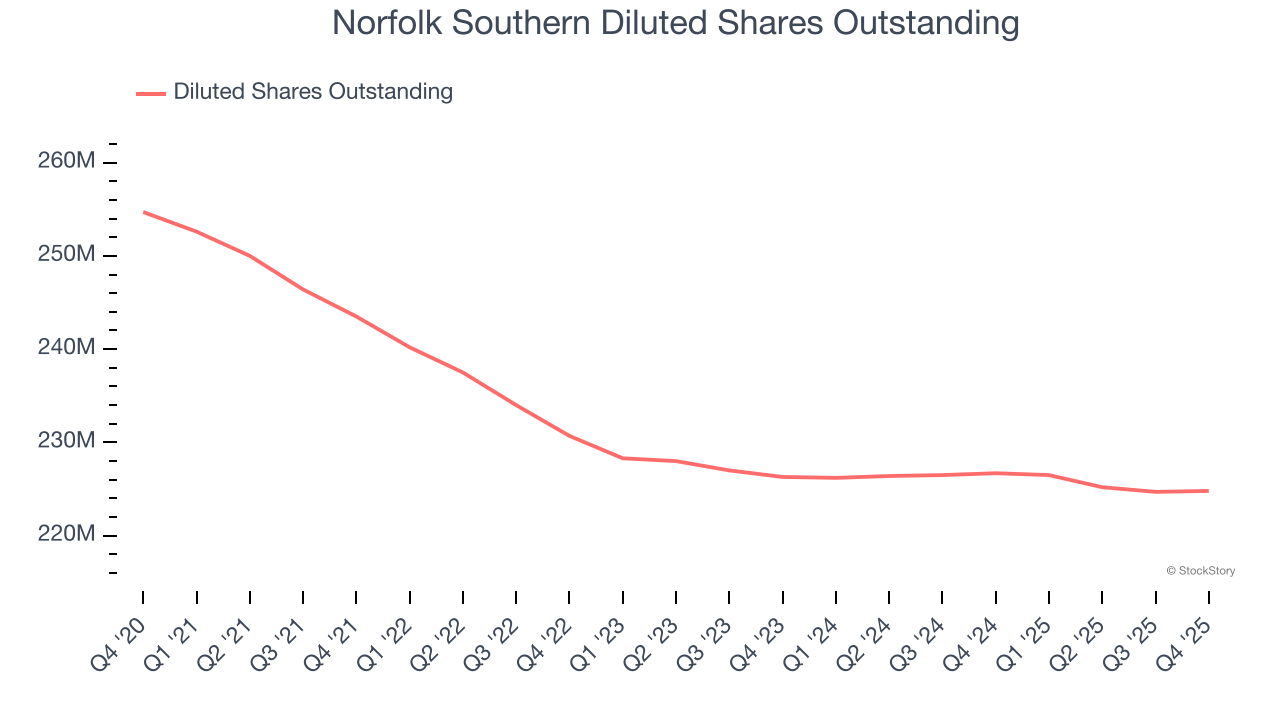
Like with revenue, we analyze EPS over a shorter period to see if we are missing a change in the business.
For Norfolk Southern, its two-year annual EPS growth of 26% was higher than its five-year trend. We love it when earnings growth accelerates, especially when it accelerates off an already high base.
In Q4, Norfolk Southern reported EPS of $2.87, down from $3.23 in the same quarter last year. Despite falling year on year, this print beat analysts’ estimates by 3.4%. Over the next 12 months, Wall Street expects Norfolk Southern’s full-year EPS of $12.76 to shrink by 2.2%.
Key Takeaways from Norfolk Southern’s Q4 Results
It was good to see Norfolk Southern beat analysts’ EPS expectations this quarter. On the other hand, its EBITDA missed and its revenue fell slightly short of Wall Street’s estimates. Overall, this was a softer quarter. The stock remained flat at $286.99 immediately after reporting.
Is Norfolk Southern an attractive investment opportunity right now? When making that decision, it’s important to consider its valuation, business qualities, as well as what has happened in the latest quarter. We cover that in our actionable full research report which you can read here (it’s free).