Aerospace and defense company Woodward (NASDAQ: WWD) beat Wall Street’s revenue expectations in Q2 CY2025, with sales up 8% year on year to $915.4 million. The company expects the full year’s revenue to be around $3.49 billion, close to analysts’ estimates. Its non-GAAP loss of $0 per share was significantly below analysts’ consensus estimates.
Is now the time to buy Woodward? Find out by accessing our full research report, it’s free.
Woodward (WWD) Q2 CY2025 Highlights:
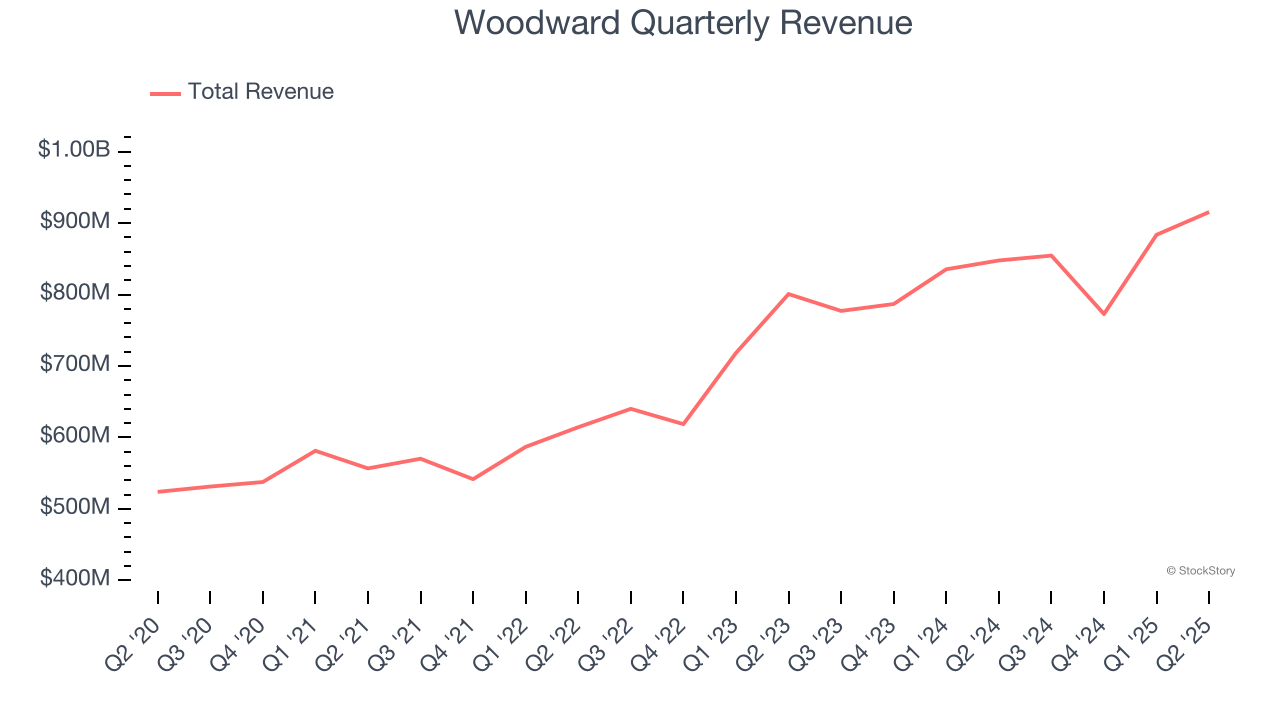
- Revenue: $915.4 million vs analyst estimates of $885.2 million (8% year-on-year growth, 3.4% beat)
- Adjusted EPS: $0 vs analyst estimates of $1.64 (significant miss)
- Adjusted EBITDA: $165.9 million vs analyst estimates of $169.7 million (18.1% margin, 2.2% miss)
- The company lifted its revenue guidance for the full year to $3.49 billion at the midpoint from $3.44 billion, a 1.5% increase
- Management raised its full-year Adjusted EPS guidance to $6.63 at the midpoint, a 8.6% increase
- Free cash flow guidance: "given the demands to support higher sales in a dynamic supply chain and production environment, we are lowering our full-year free cash flow guidance"
- Operating Margin: 17.5%, up from 13.9% in the same quarter last year
- Free Cash Flow Margin: 10.8%, down from 16.2% in the same quarter last year
- Market Capitalization: $15.31 billion
"We delivered strong results in the third quarter underpinned by robust demand across our end markets, coupled with disciplined execution by our global teams,” said Chip Blankenship, Chairman and Chief Executive Officer.
Company Overview
Initially designing controls for water wheels in the early 1900s, Woodward (NASDAQ: WWD) designs, services, and manufactures energy control products and optimization solutions.
Revenue Growth
Reviewing a company’s long-term sales performance reveals insights into its quality. Any business can have short-term success, but a top-tier one grows for years. Over the last five years, Woodward grew its sales at a tepid 4.9% compounded annual growth rate. This was below our standard for the industrials sector and is a rough starting point for our analysis.
Long-term growth is the most important, but within industrials, a half-decade historical view may miss new industry trends or demand cycles. Woodward’s annualized revenue growth of 11.1% over the last two years is above its five-year trend, suggesting its demand recently accelerated. 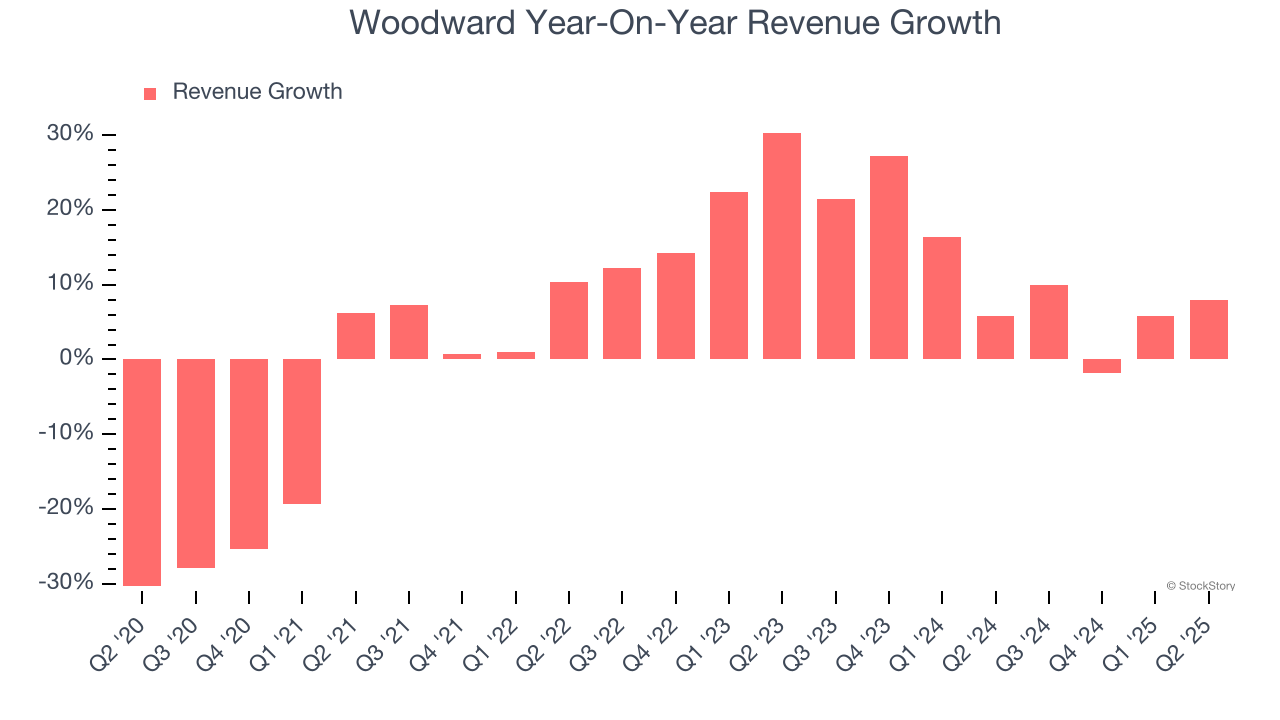
This quarter, Woodward reported year-on-year revenue growth of 8%, and its $915.4 million of revenue exceeded Wall Street’s estimates by 3.4%.
Looking ahead, sell-side analysts expect revenue to grow 8.4% over the next 12 months, a slight deceleration versus the last two years. Despite the slowdown, this projection is above average for the sector and indicates the market is forecasting some success for its newer products and services.
Software is eating the world and there is virtually no industry left that has been untouched by it. That drives increasing demand for tools helping software developers do their jobs, whether it be monitoring critical cloud infrastructure, integrating audio and video functionality, or ensuring smooth content streaming. Click here to access a free report on our 3 favorite stocks to play this generational megatrend.
Operating Margin
Woodward has managed its cost base well over the last five years. It demonstrated solid profitability for an industrials business, producing an average operating margin of 11.2%.
Looking at the trend in its profitability, Woodward’s operating margin rose by 3 percentage points over the last five years, as its sales growth gave it operating leverage.
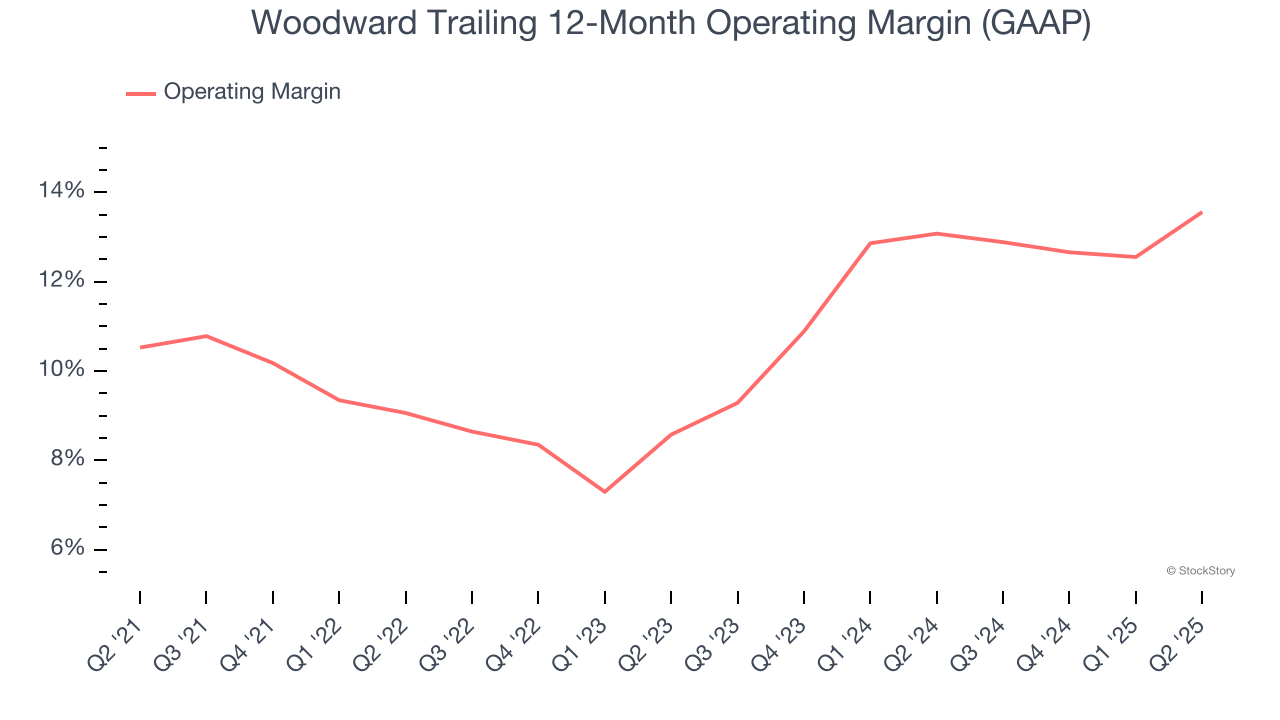
In Q2, Woodward generated an operating margin profit margin of 17.5%, up 3.7 percentage points year on year. This increase was a welcome development and shows it was more efficient.
Earnings Per Share
We track the long-term change in earnings per share (EPS) for the same reason as long-term revenue growth. Compared to revenue, however, EPS highlights whether a company’s growth is profitable.
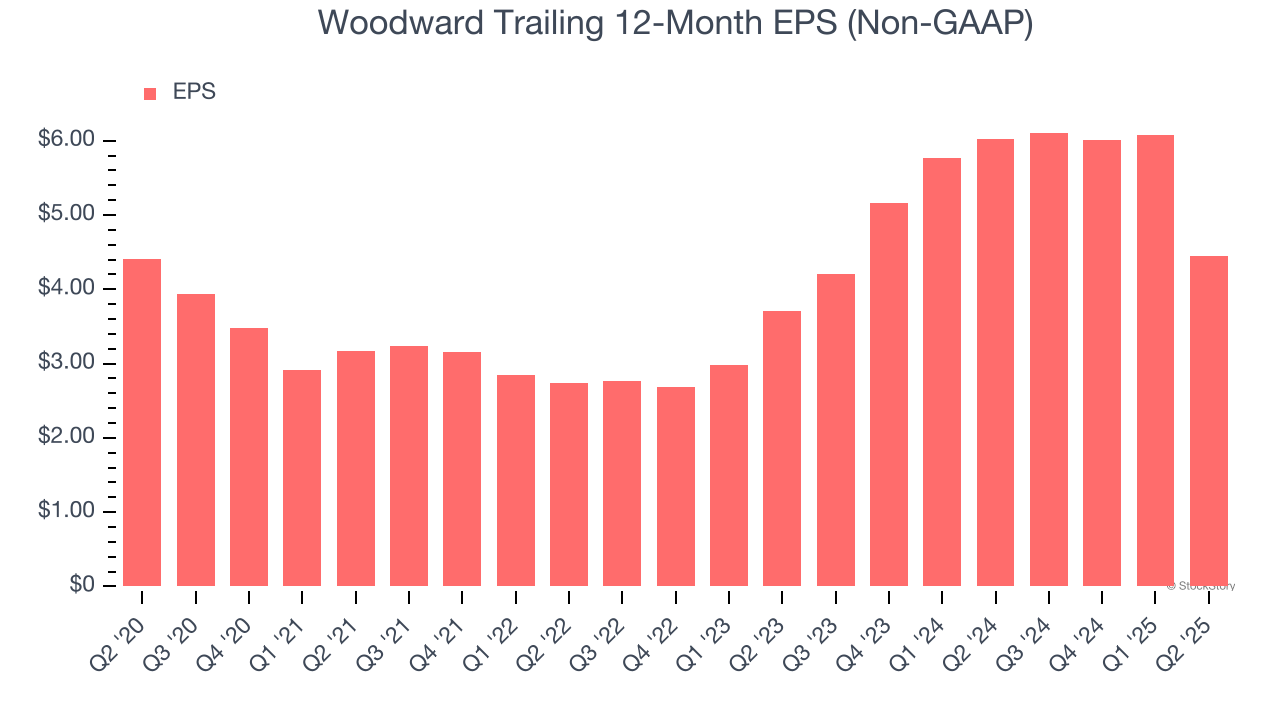
Woodward’s flat EPS over the last five years was below its 4.9% annualized revenue growth. We can see the difference stemmed from higher interest expenses or taxes as the company actually improved its operating margin and repurchased its shares during this time.
Like with revenue, we analyze EPS over a shorter period to see if we are missing a change in the business.
For Woodward, its two-year annual EPS growth of 9.5% was higher than its five-year trend. Accelerating earnings growth is almost always an encouraging data point.
In Q2, Woodward reported EPS at $0, down from $1.63 in the same quarter last year. This print missed analysts’ estimates. Over the next 12 months, Wall Street expects Woodward’s full-year EPS of $4.45 to grow 64%.
Key Takeaways from Woodward’s Q2 Results
Revenue in the quarter beat, but EBITDA missed. Looking ahead, full-year EPS guidance was raised and came in ahead of expectations. On the other hand, free cash flow guidance was lowered due to "the demands to support higher sales in a dynamic supply chain and production environment". Overall, this print was mixed. The market seemed to be hoping for more consistent performance and a brighter outlook, and the stock traded down 3.3% to $249.92 immediately following the results.
Is Woodward an attractive investment opportunity at the current price? What happened in the latest quarter matters, but not as much as longer-term business quality and valuation, when deciding whether to invest in this stock. We cover that in our actionable full research report which you can read here, it’s free.