
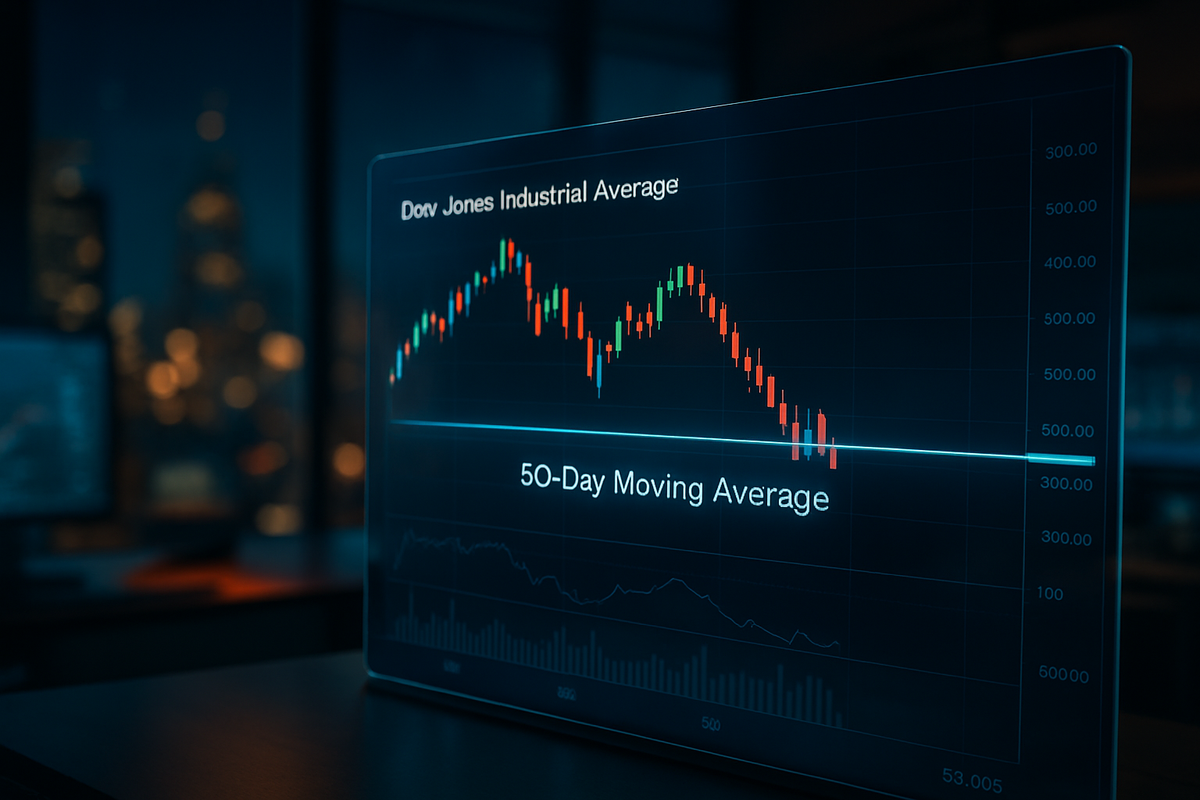
The Dow Jones Industrial Average (DJIA) is facing a critical juncture as the 2025 trading year draws to a close. After a volatile month marked by a record-breaking "Santa Claus Rally" followed by a sharp three-session pullback, the blue-chip index is currently testing key technical support levels that could determine its trajectory for the opening of 2026. As of December 30, 2025, the index sits at 48,461.93, hovering precariously near its 50-day moving average—a level that technical analysts describe as the "last line of defense" for the short-term bullish trend.
This recent retreat comes on the heels of an all-time high of 48,886.86 reached in mid-December. While the broader market sentiment remains cautiously optimistic due to cooling inflation and a more accommodative Federal Reserve, the consecutive losses over the final week of the year have sparked concerns about exhaustion among buyers. Market participants are now laser-focused on whether the Dow can maintain its footing above 48,435 or if a deeper correction toward the 200-day moving average is imminent.
The Path to the Pivot: A December of Extremes
The final quarter of 2025 has been anything but quiet for the New York Stock Exchange and the Nasdaq. The market began December under the shadow of a historic 43-day federal government shutdown that ended in mid-November. The resolution of that crisis, combined with the Federal Reserve’s decision on December 10 to implement its third consecutive 25-basis-point rate cut, initially propelled the Dow to new heights. By mid-month, the federal funds rate sat at a range of 3.50%–3.75%, providing the liquidity needed for a massive year-end surge.
However, the momentum stalled as the "One Big Beautiful Bill Act" (OBBBA) faced final regulatory scrutiny before its 2026 implementation. While the act promises significant corporate tax credits, the uncertainty regarding its immediate impact on earnings led to a "sell the news" reaction among institutional investors. This, coupled with year-end tax-loss harvesting and profit-taking after a 15% year-to-date gain, resulted in the current three-day losing streak. The index’s struggle at the 48,435 support level represents a tug-of-war between value hunters and those fearing a broader mean reversion.
The Corporate Tug-of-War: Winners and Losers in the Blue-Chip Index
The Dow’s unique price-weighted structure means that a handful of high-priced stocks are currently dictating the index's fate. Microsoft Corp. (NASDAQ: MSFT) has remained a primary pillar of strength, trading near $490. With an AI-driven revenue run rate hitting $13 billion annually by late 2025, MSFT has acted as a stabilizing force, preventing the index from a more severe breakdown. Similarly, Goldman Sachs Group Inc. (NYSE: GS) has emerged as a financial anchor, trading around $907. The firm has benefited from a resurgence in global M&A activity and the favorable interest rate environment, with analysts recently raising price targets to nearly $971.
Conversely, the index has been significantly weighed down by UnitedHealth Group Inc. (NYSE: UNH). The healthcare giant has been the Dow’s largest drag throughout 2025, falling approximately 35% over the year due to ongoing federal probes into Medicare billing and escalating medical costs. Currently trading near $330, UNH is testing its own multi-year lows. While some contrarian investors see a "double-bottom" formation that could trigger a 2026 rally, its continued weakness remains a primary reason the Dow is struggling to maintain its technical support levels.
Broader Significance: A "Soft Landing" in the Balance
The current technical struggle of the Dow is more than just a chart pattern; it is a reflection of the broader economic transition occurring at the end of 2025. The December 18 inflation report, which showed the Consumer Price Index (CPI) cooling to 2.7%, suggests that the Federal Reserve has successfully navigated the economy toward a "soft landing." However, the thinness of the recent rally—largely concentrated in financials and tech—suggests that the industrial and consumer discretionary sectors are still feeling the lag effects of previous rate hikes.
Historically, when the Dow tests its 50-day moving average at the end of a calendar year, it often serves as a springboard for a "January Effect" rally. However, if the index fails to hold 48,435, the next structural support doesn't appear until the 200-day moving average near 47,856. A breach of that level would signal a shift from a "buy-the-dip" mentality to a more defensive posture, potentially impacting the rollout of the OBBBA and other legislative incentives aimed at boosting domestic manufacturing and infrastructure.
Looking Ahead: The 50,000 Milestone and Beyond
As we move into the first week of 2026, the primary objective for bulls will be to reclaim the 48,886 peak and set their sights on the psychological milestone of 50,000. Short-term, the market will require a catalyst, likely in the form of robust manufacturing data or further clarity on the OBBBA tax credits, to reverse the current downward drift. If the Dow can stabilize above 48,400 in the coming sessions, it will likely confirm that the recent losses were merely a healthy consolidation rather than the start of a bear market.
Strategic pivots may be required for investors who have been overweight in defensive sectors like healthcare. If UNH and other laggards begin to find a floor, a rotation back into "value" could provide the necessary fuel to push the Dow through its current resistance. Conversely, a failure to hold the 50-day moving average may force a shift toward high-yield cash equivalents or short-duration bonds as investors wait for a more definitive bottom near the 47,000 "line in the sand."
The Final Verdict: A Market at a Crossroads
The Dow Jones Industrial Average concludes 2025 in a state of high-stakes suspense. While the 15% annual gain is a testament to the resilience of the U.S. economy following the government shutdown, the current technical fragility cannot be ignored. The index is essentially "flat-lining" on its 50-day support, waiting for a signal to either resume its upward climb or succumb to a deeper retracement.
Investors should watch the 48,435 level closely in the first trading sessions of January. A decisive close below this mark, accompanied by high volume, would suggest that the market needs more time to digest its 2025 gains. However, with inflation under control and the Fed in a cutting cycle, the underlying fundamentals remain supportive. The coming months will likely be defined by whether the Dow can transform its current support levels into a launchpad for the historic march toward 50,000.
This content is intended for informational purposes only and is not financial advice.


