
Iconic recreational vehicle (RV) manufacturer Winnebago Industries Inc. (NYSE: WGO) shares are trading in a rectangle price range as normalization continues to set in after banner calendar years 2021-2022. Rising interest rates and a weakening economy have caused a reversion in consumer discretionary items as consumers tighten their wallets.
As strong as the elastic office and outdoor leisure and lifestyle trend spawned by the pandemic has been, a normalization was bound to happen. This makes year-over-year (YoY) comparisons tough since calendar years 2021 to 2022 were record-setting. Gross profits tanked (-30.1%) compared to the record-setting year-ago period, driven by inflationary pressures on pricing and supply chain disruptions.
Peers Set the Bar Too High
Competitor Polaris Inc. (NYSE: PII) recorded a $0.47 EPS beat and issued upside guidance in October 2022, setting a high bar. Camping World Holdings Inc. (NYSE: CWH) missed its estimates (-$0.31), but revenues only fell (-3.2%), and new vehicle sales down (-3.5%) in its Q3 2022 report.
While Winnebago’s recent earnings report beat estimates, they didn’t crush them like competitor THOR Industries Inc. (NYSE: THO) who reported a $0.71 EPS beat despite a (-21%) fall in revenues just a week prior. This likely continued to set the bar too high when Winnebago reported a smaller beat. The main question is when normalization will finally flatten itself out.
Tough YoY Comps to Contend With
On Dec. 16, 2022, Winnebago released its fiscal first-quarter 2022 results for November 2022. The Company reported a profit of $2.07 per share, beating consensus analyst estimates for $1.79 per share by $0.28 per share. Revenues fell (-17.6%) year-over-year (YoY) to $952.2 million, beating consensus analyst estimates for $866.11 million.
Unit volumes fell from the record year-ago comps. The Marine segment continued to grow by unit and price increases in all segments related to higher materials and components costs. Gross profit fell (-30.1%) to $160.4 million versus $229.4 million.
Normalization Clamping Down
The gross profit margin was 16.8% down (-300 bps). Net income fell (-39.6%) to $60.2 million as adjusted EPS fell (-41%) to $2.07 from $3.51 in the year-ago period. The Towable segment fell (-46.7%) to $347.3 million. Backlog fell (-76.9%) to $34 million. On a bright note, Motorhome sales grew 10.1% YoY to $464.2 million, mostly due to price increases.
Marine segment revenues climbed 65.7% to $131.4 million on both unit volume and price increase. The Company has total outstanding debt of $590.4 million and $617.7 million in working capital and generated $29.9 million in cash flow from operations in the quarter.
CEO Remains Upbeat
Winnebago CEO Michael Happe commented, “…Growth in our Motorhome and Marine segments helped to mitigate challenging market conditions in our Towables business, demonstrating the ongoing benefits of a more balanced array of outdoor recreation businesses. We are also proud of our team's investments in strengthening our golden threads of quality, innovation and experience.” He concluded, “…We expect some supply chain issues and the normalization of outdoor retail demand to continue through the rest of this period, yet we are focused on maintaining solid profitability by leveraging our highly variable cost structure, strong relationships with dealers and suppliers, and the appeal of our increasingly diverse portfolio of premium brands.”
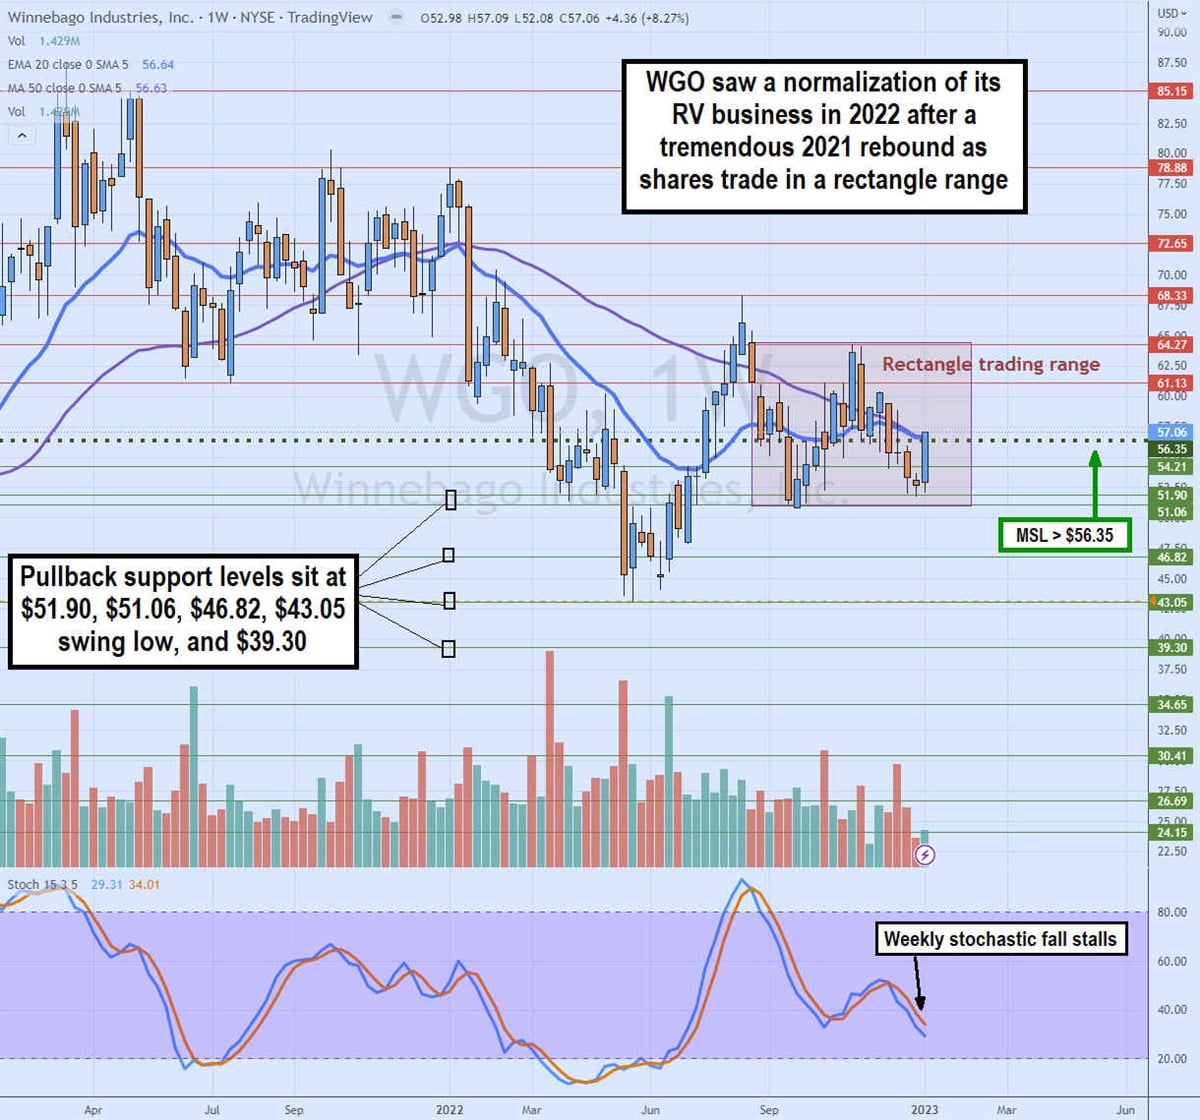
Rectangle Trading Range
The weekly candlestick chart for WGO indicates a 13-point rectangle trading range spanning a low of $51.06 and a top of around $64.27. Shares peaked at $78.88 a year ago in January 2022 and continued to descend, hitting a low of $43.05 by May. Shares staged a recovery as high as $68.33 before falling to a swing lower of $51.06 in September.
Since then, it has been in the rectangle trading range with a weekly market structure low (MSL) buy trigger on a breakout through $56.35.The weekly exponential 20-period moving average (MA) overlaps with the weekly 50-period MA, which also overlaps near the weekly MSL trigger at $56.64.
The weekly stochastic is falling at the 40-band, but the recent large green candle spike to test the weekly MSL trigger is causing it to stall the fall.
Pullback support areas sit at the $51.90 and $51.06 lower range of the rectangle trading range, $46.82, $43.05 swing low, and $39.30.


