
- Global entertainment platform delivers Q4 Net Income of $5 million (+112% YoY), at a 5.7% margin, EPS(1) of 10 cents (+100% YoY), Adjusted EPS of 27 cents (+59% YoY) and Total Adjusted EBITDA(2) of $37 million (+48% YoY) at a 40% margin.
- Full-Year Net Income of $26 million (+3% YoY) at a 7.4% margin, Total Adjusted EBITDA of $139 million (-4% YoY) at a 39.4% margin (in line with guidance of high 30’s) and Cash from Operations of $71 million (+21% YoY).
- IMAX delivers 146 system installations for the full year, at the high-end of initial installation guidance of 120 to 150.
- To start 2025, IMAX smashes box office record for Chinese New Year slate with $130 million and counting — already up over 90% from the previous best — led by “Ne Zha 2,” now the highest grossing IMAX release of all time in China.
- IMAX expects in 2025 to deliver a record box office of more than $1.2 billion along with Total Adjusted EBITDA margin(3) of 40%+ and system installations of 145 to 160.
IMAX Corporation (NYSE: IMAX) today reported solid financial results for the fourth quarter and full-year of 2024, demonstrating the value of its unique global entertainment platform and broad content portfolio.
This press release features multimedia. View the full release here: https://www.businesswire.com/news/home/20250219198942/en/
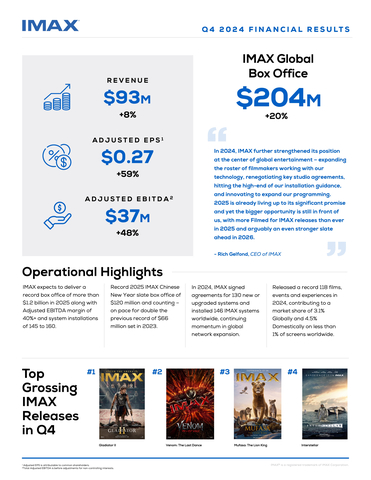
An infographic highlighting IMAX's recent quarter. (Graphic: Business Wire)
“IMAX’s record-breaking Chinese New Year demonstrates the unique advantages of our model – a richly diversified content portfolio featuring the biggest Hollywood and local language blockbusters, and a global network that allows us to capitalize on box office momentum anywhere in the world,” said Rich Gelfond, CEO of IMAX.
“2025 is already living up to its significant promise and yet the bigger opportunity is still in front of us, with more Filmed for IMAX® releases than ever in 2025 and arguably an even stronger slate ahead in 2026. In China, the turnaround we’re witnessing this year has been dramatic; in less than two months, our Chinese local language box office has already exceeded the entirety of 2024."
“In 2024, IMAX further strengthened its position at the center of global entertainment – expanding the roster of filmmakers working with our technology, strengthening our studio marketing, hitting the high-end of our installation guidance, and innovating to expand our programming – including our deal with Netflix for the release of Greta Gerwig’s ‘Narnia’ across the IMAX global network in advance of its debut on the service.”
“With the headwinds we faced in China in 2024 beginning to lift, we’re poised to build on the Fourth Quarter’s significant double-digit growth in adjusted EBITDA and earnings per share. We look forward to capitalizing on the promising opportunity ahead to achieve a record year at the global box office and strong returns for our shareholders.”
| _______________ | ||
(1) |
|
Diluted Net Income Per Share |
(2) |
|
Non-GAAP Financial Measure. See the discussion at the end of this earnings release for a description of the non-GAAP financial measures used herein, as well as reconciliations to the most comparable GAAP amounts. |
(3) |
|
IMAX has not provided a quantitative reconciliation of its Total Adjusted EBITDA margin outlook to a GAAP net income margin outlook because it is unable, without making unreasonable efforts, to project certain reconciling items. These items include, but are not limited to share-based and other non-cash compensation, unrealized investment gains, transaction-related expenses, restructuring and other charges, and write-downs, including asset impairments and credit loss reversal. These items are inherently variable and uncertain and depend on various factors, some of which are outside of the IMAX’s control or ability to predict. For more information regarding the Company’s use of non-GAAP financial measures, please see the section titled “Non-GAAP Financial Measures” below. |
Fourth Quarter and Full-Year Financial Highlights
|
Three Months Ended December 31, (Unaudited) |
|
Years Ended December 31, |
||||||||||||||||||
In millions of U.S. Dollars, except per share data |
|
2024 |
|
|
|
2023 |
|
|
YoY % Change |
|
|
2024 |
|
|
|
2023 |
|
|
YoY % Change |
||
Total Revenue |
$ |
92.7 |
|
|
$ |
86.0 |
|
|
8 |
% |
|
$ |
352.2 |
|
|
$ |
374.8 |
|
|
(6 |
%) |
|
|
|
|
|
|
|
|
|
|
|
|
||||||||||
Gross Margin |
$ |
48.4 |
|
|
$ |
43.7 |
|
|
11 |
% |
|
$ |
190.2 |
|
|
$ |
214.3 |
|
|
(11 |
%) |
Gross Margin (%) |
|
52.2 |
% |
|
|
50.8 |
% |
|
|
|
|
54.0 |
% |
|
|
57.2 |
% |
|
|
||
|
|
|
|
|
|
|
|
|
|
|
|
||||||||||
Total Adjusted EBITDA(1)(2) |
$ |
37.2 |
|
|
$ |
25.2 |
|
|
48 |
% |
|
$ |
138.9 |
|
|
$ |
144.0 |
|
|
(4 |
%) |
Total Adjusted EBITDA Margin (%)(1)(2) |
|
40.1 |
% |
|
|
29.3 |
% |
|
|
|
|
39.4 |
% |
|
|
38.4 |
% |
|
|
||
|
|
|
|
|
|
|
|
|
|
|
|
||||||||||
Net Income(3) |
$ |
5.3 |
|
|
$ |
2.5 |
|
|
112 |
% |
|
$ |
26.1 |
|
|
$ |
25.3 |
|
|
3 |
% |
Diluted Net Income Per Share(3) |
$ |
0.10 |
|
|
$ |
0.05 |
|
|
100 |
% |
|
$ |
0.48 |
|
|
$ |
0.46 |
|
|
4 |
% |
|
|
|
|
|
|
|
|
|
|
|
|
||||||||||
Adjusted Net Income(1)(3) |
$ |
14.5 |
|
|
$ |
9.3 |
|
|
56 |
% |
|
$ |
51.0 |
|
|
$ |
52.1 |
|
|
(2 |
%) |
Adjusted Earnings Per Share(1)(3) |
$ |
0.27 |
|
|
$ |
0.17 |
|
|
59 |
% |
|
$ |
0.95 |
|
|
$ |
0.94 |
|
|
1 |
% |
|
|
|
|
|
|
|
|
|
|
|
|
||||||||||
Weighted average shares outstanding (in millions): |
|
|
|
|
|
|
|
|
|
|
|
||||||||||
Basic |
|
52.8 |
|
|
|
54.0 |
|
|
(2 |
%) |
|
|
52.6 |
|
|
|
54.3 |
|
|
(3 |
%) |
Diluted |
|
54.7 |
|
|
|
55.0 |
|
|
(1 |
%) |
|
|
53.9 |
|
|
|
55.1 |
|
|
(2 |
%) |
| _______________ | ||
(1) |
|
Non-GAAP Financial Measure. See the discussion at the end of this earnings release for a description of the non-GAAP financial measures used herein, as well as reconciliations to the most comparable GAAP amounts. |
(2) |
|
Total Adjusted EBITDA is before adjustments for non-controlling interests. Total Adjusted EBITDA per Credit Facility attributable to common shareholders, excluding non-controlling interests, was $34.2 million and $124.7 million for the three months and year ended December 31, 2024 (2023 - $23.0 million and $128.1 million). The Company’s Credit Facility covenant is calculated on a trailing twelve month basis. |
(3) |
|
Attributable to common shareholders. |
Fourth Quarter and Full-Year Segment Results(1)
|
Content Solutions |
|
Technology Products and Services |
||||||||||||||||||
|
Revenue |
|
Gross Margin |
|
Gross Margin % |
|
Revenue |
|
Gross Margin |
|
Gross Margin % |
||||||||||
4Q24 |
$ |
25.5 |
|
|
$ |
11.8 |
|
|
46 |
% |
|
$ |
64.0 |
|
|
$ |
34.2 |
|
|
53 |
% |
4Q23 |
|
19.1 |
|
|
|
9.7 |
|
|
51 |
% |
|
|
62.5 |
|
|
|
29.9 |
|
|
48 |
% |
% change |
|
34 |
% |
|
|
22 |
% |
|
|
|
|
2 |
% |
|
|
15 |
% |
|
|
||
|
|
|
|
|
|
|
|
|
|
|
|
||||||||||
FY24 |
$ |
124.7 |
|
|
$ |
66.5 |
|
|
53 |
% |
|
$ |
216.1 |
|
|
$ |
115.6 |
|
|
53 |
% |
FY23 |
|
126.7 |
|
|
|
74.1 |
|
|
58 |
% |
|
|
234.3 |
|
|
|
129.9 |
|
|
55 |
% |
% change |
|
(2 |
%) |
|
|
(10 |
%) |
|
|
|
|
(8 |
%) |
|
|
(11 |
%) |
|
|
||
| _______________ | ||
(1) |
|
Please refer to the Company’s Form 10-K for the year ended December 31, 2024 for additional segment information. |
Content Solutions Segment
- Fourth quarter Content Solutions revenues and gross margin increased 34% year-over-year to $26 million, and increased 22% year-over-year to $12 million, respectively, driven by higher box office, and highlighted by record Thanksgiving weekend box office of $24 million.
- Fourth quarter box office of $204 million increased 20% year-over-year and helped propel IMAX to near-record annual domestic box office. Top grossing fourth quarter titles included Gladiator 2 ($31 million), Venom: The Last Dance ($31 million), Mufasa: The Lion King ($26 million) and Interstellar ($20 million)
Technology Products and Services Segment
- Fourth quarter Technology Products and Services revenues and gross margin increased 2% to $64 million and increased 15% to $34 million year-over-year, respectively, driven by higher box office related rental revenue that more than offset a lower level of sales type system installations year-over-year.
- During the fourth quarter of 2024, the Company installed 58 systems, compared to 69 systems in the fourth quarter of 2023, resulting in 146 system installations in the full year versus 128 system installations in the prior year. Of those, 28 systems in the fourth quarter and 63 in the full year were under sales arrangements, compared to 35 and 70 systems in the prior year, respectively.
- Commercial network growth continues with the number of IMAX locations increasing 2.5% year-over-year to 1,735 systems. The Company ended 2024 with a backlog of 440 IMAX systems.
Operating Cash Flow and Liquidity
Net cash provided by operating activities for full year 2024 was $71 million, compared to $59 million in the prior year period, reflecting improvements in working capital driven by higher collections.
As of December 31, 2024, the Company’s available liquidity was $418 million. The Company’s liquidity includes cash and cash equivalents of $101 million, $263 million in available borrowing capacity under the Credit Facility, and $54 million in available borrowing capacity under IMAX China’s revolving facilities. Total debt, excluding deferred financing costs, was $269 million as of December 31, 2024.
In 2021, the Company issued $230.0 million of 0.500% Convertible Senior Notes due 2026 (“Convertible Notes”). In connection with the pricing of the Convertible Notes, the Company entered into privately negotiated capped call transactions with an initial cap price of $37.2750 per share of the Company’s common shares.
Share Count and Capital Return
The weighted average basic and diluted shares outstanding in the fourth quarter of 2024 were 52.8 million and 54.7 million, respectively, compared to 54.0 million and 55.0 million in the fourth quarter of 2023, a decrease of 2.2% and 0.5%, respectively.
For the year ended December 31, 2024, the Company repurchased 1,166,370 common shares at an average price of $13.99 for a total of $16 million, excluding commissions.
The Company is authorized under its share-repurchase program, expiring June 30, 2026 to repurchase up to $400 million of its common shares, of which approximately $151 million remains available.
Supplemental Materials
For more information about the Company’s results, please refer to the IMAX Investor Relations website located at investors.imax.com.
Investor Relations Website and Social Media
On a monthly basis, the Company posts quarter-to-date box office results on the IMAX Investor Relations website located at investors.imax.com. The Company expects to provide such updates within five business days of month-end, although the Company may change this timing without notice.
The Company may post additional information on the Company’s corporate and Investor Relations websites which may be material to investors. Accordingly, investors, media and others interested in the Company should monitor the Company’s website in addition to the Company’s press releases, SEC filings and public conference calls and webcasts, for additional information about the Company. References to our website address and domain names throughout this release are for informational purposes only, or to fulfill specific disclosure requirements of the Securities and Exchange Commission’s rules or The New York Stock Exchange Listing Standards. These references are not intended to, and do not, incorporate the contents of our websites by reference into this release.
Conference Call
The Company will host a conference call today at 4:30 PM ET to discuss its fourth quarter and full-year 2024 financial results. This call is being webcast and can be accessed at investors.imax.com. To access the call via telephone, interested parties please pre-register here: https://register.vevent.com/register/BI5416215ae6134b378b06870a2fb47726 and you will be provided with a dial-in number and unique pin. To avoid delays, we encourage participants to dial into the conference call ten minutes ahead of the scheduled start time. A replay of the call will be available via webcast at investors.imax.com.
About IMAX Corporation
IMAX, an innovator in entertainment technology, combines proprietary software, architecture, and equipment to create experiences that take you beyond the edge of your seat to a world you’ve never imagined. Top filmmakers and studios are utilizing IMAX systems to connect with audiences in extraordinary ways, making IMAX’s network among the most important and successful theatrical distribution platforms for major event films around the globe.
IMAX is headquartered in New York, Toronto, and Los Angeles, with additional offices in London, Dublin, Tokyo, and Shanghai. As of December 31, 2024, there were 1,807 IMAX systems (1,735 commercial multiplexes, 11 commercial destinations, 61 institutional) operating in 90 countries and territories. Shares of IMAX China Holding, Inc., a subsidiary of IMAX Corporation, trade on the Hong Kong Stock Exchange under the stock code “1970”.
IMAX®, IMAX 3D®, Experience It In IMAX®, The IMAX Experience®, DMR®, Filmed For IMAX®, IMAX Live®, IMAX Enhanced® and IMAX StreamSmart™ are trademarks and trade names of the Company or its subsidiaries that are registered or otherwise protected under laws of various jurisdictions. For more information, visit www.imax.com. You can also connect with IMAX on Instagram (www.instagram.com/company/imax), Facebook (www.facebook.com/imax), LinkedIn (www.linkedin.com/company/imax), X (www.twitter.com/imax), and YouTube (www.youtube.com/imaxmovies).
Forward-Looking Statements
This earnings release contains forward looking statements that are based on IMAX management’s assumptions and existing information and involve certain risks and uncertainties which could cause actual results to differ materially from future results expressed or implied by such forward looking statements. These forward-looking statements include, but are not limited to, references to business and technology strategies and measures to implement strategies, competitive strengths, goals, expansion and growth of business, operations and technology, future capital expenditures (including the amount and nature thereof), industry prospects and consumer behavior, plans and references to the future success of IMAX Corporation together with its consolidated subsidiaries (the “Company”) and expectations regarding the Company’s future operating, financial and technological results. These forward-looking statements are based on certain assumptions and analyses made by the Company in light of its experience and its perception of historical trends, current conditions and expected future developments, as well as other factors it believes are appropriate in the circumstances. However, whether actual results and developments will conform with the expectations and predictions of the Company is subject to a number of risks and uncertainties, including, but not limited to, risks associated with investments and operations in foreign jurisdictions and any future international expansion, including those related to economic, political and regulatory policies of local governments and laws and policies of the United States and Canada, as well as geopolitical conflicts; risks related to the Company’s growth and operations in China; the performance of IMAX remastered films and other films released to the IMAX network; the signing of IMAX System agreements; conditions, changes and developments in the commercial exhibition industry; risks related to currency fluctuations; the potential impact of increased competition in the markets within which the Company operates, including competitive actions by other companies; the failure to respond to change and advancements in technology; risks relating to consolidation among commercial exhibitors and studios; risks related to brand extensions and new business initiatives; conditions in the in-home and out-of-home entertainment industries; the opportunities (or lack thereof) that may be presented to and pursued by the Company; risks related to cyber-security and data privacy; risks related to the Company’s inability to protect the Company’s intellectual property; risks associated with the Company’s use of artificial intelligence and exploration of additional use cases of artificial intelligence; risks related to climate change; risks related to weather conditions and natural disasters that may disrupt or harm the Company’s business; risks related to the Company’s indebtedness and compliance with its debt agreements; general economic, market or business conditions; risks related to political, economic and social instability; the failure to convert system backlog into revenue; changes in laws or regulations; any statements of belief and any statements of assumptions underlying any of the foregoing; other factors and risks outlined in the Company’s periodic filings with the SEC; and other factors, many of which are beyond the control of the Company. Consequently, all of the forward-looking statements made in this earnings release are qualified by these cautionary statements, and actual results or anticipated developments by the Company may not be realized, and even if substantially realized, may not have the expected consequences to, or effects on, the Company. These factors, other risks and uncertainties and financial details are discussed in the Company’s most recent Annual Report on Form 10-K. The Company undertakes no obligation to update publicly or otherwise revise any forward-looking statements, whether as a result of new information, future events or otherwise.
IMAX Network and Backlog
|
Three Months Ended |
|
Years Ended |
||||||||||||
|
December 31, |
|
December 31, |
||||||||||||
|
|
2024 |
|
|
|
2023 |
|
|
|
2024 |
|
|
|
2023 |
|
System Signings(1): |
|
|
|
|
|
|
|
||||||||
Sales Arrangements |
|
14 |
|
|
10 |
|
|
54 |
|
|
64 |
||||
Traditional JRSA |
|
5 |
|
|
|
25 |
|
|
|
76 |
|
|
|
65 |
|
Total IMAX System Signings |
|
19 |
|
|
|
35 |
|
|
|
130 |
|
|
|
129 |
|
(1) System signings include new signings of 15 in Q4 2024 and 32 in Q4 2023, and 57 in 2024 and 108 in 2023. |
|||||||||||||||
|
Three Months Ended |
|
Years Ended |
||||||||||||
|
December 31, |
|
December 31, |
||||||||||||
|
|
2024 |
|
|
|
2023 |
|
|
|
2024 |
|
|
|
2023 |
|
System Installations(1): |
|
|
|
|
|
|
|
||||||||
Sales Arrangements |
|
27 |
|
|
35 |
|
|
63 |
|
|
70 |
||||
Hybrid JRSA |
|
— |
|
|
|
3 |
|
|
|
— |
|
|
|
5 |
|
Traditional JRSA |
|
31 |
|
|
|
31 |
|
|
|
83 |
|
|
|
53 |
|
Total IMAX System Installations |
|
58 |
|
|
|
69 |
|
|
|
146 |
|
|
|
128 |
|
(1) System installations include new systems installations of 32 in Q4 2024, 47 in Q4 2023, 77 in 2024 and 86 in 2023. |
|||||||||||||||
|
As of December 31, |
||||||
|
|
2024 |
|
|
|
2023 |
|
System Backlog: |
|
|
|
||||
Sales Arrangements |
|
164 |
|
|
164 |
||
Hybrid JRSA |
|
94 |
|
|
|
103 |
|
Traditional JRSA |
|
182 |
|
|
|
183 |
|
Total System Backlog |
|
440 |
|
|
|
450 |
|
|
|
|
|
||||
|
As of December 31, |
||||||
|
|
2024 |
|
|
|
2023 |
|
System Network: |
|
|
|
||||
Commercial Multiplex Systems |
|
|
|
||||
Sales Arrangements |
|
838 |
|
|
|
769 |
|
Hybrid JRSA |
|
126 |
|
|
|
138 |
|
Traditional JRSA |
|
771 |
|
|
|
786 |
|
Total Commercial Multiplex Systems |
|
1,735 |
|
|
|
1,693 |
|
Commercial Destination Systems |
|
11 |
|
|
|
12 |
|
Institutional Systems |
|
61 |
|
|
|
67 |
|
Total System Network |
|
1,807 |
|
|
|
1,772 |
|
IMAX CORPORATION CONSOLIDATED STATEMENTS OF OPERATIONS (In thousands of U.S. dollars, except per share amounts) |
|||||||||||||||
|
Three Months Ended |
|
Years Ended |
||||||||||||
|
December 31,
|
|
December 31, |
||||||||||||
|
|
2024 |
|
|
|
2023 |
|
|
|
2024 |
|
|
|
2023 |
|
Revenues |
|
|
|
|
|
|
|
||||||||
Technology sales |
$ |
33,136 |
|
|
$ |
35,337 |
|
|
$ |
87,765 |
|
|
$ |
100,792 |
|
Image enhancement and maintenance services |
|
42,769 |
|
|
|
35,508 |
|
|
|
192,197 |
|
|
|
189,752 |
|
Technology rentals |
|
13,794 |
|
|
|
12,954 |
|
|
|
62,560 |
|
|
|
75,566 |
|
Finance income |
|
2,973 |
|
|
|
2,219 |
|
|
|
9,686 |
|
|
|
8,729 |
|
|
|
92,672 |
|
|
|
86,018 |
|
|
|
352,208 |
|
|
|
374,839 |
|
Costs and expenses applicable to revenues |
|
|
|
|
|
|
|
||||||||
Technology sales |
|
13,641 |
|
|
|
17,805 |
|
|
|
38,235 |
|
|
|
46,756 |
|
Image enhancement and maintenance services |
|
23,187 |
|
|
|
18,586 |
|
|
|
96,558 |
|
|
|
88,056 |
|
Technology rentals |
|
7,479 |
|
|
|
5,939 |
|
|
|
27,215 |
|
|
|
25,686 |
|
|
|
44,307 |
|
|
|
42,330 |
|
|
|
162,008 |
|
|
|
160,498 |
|
Gross margin |
|
48,365 |
|
|
|
43,688 |
|
|
|
190,200 |
|
|
|
214,341 |
|
Selling, general and administrative expenses |
|
32,414 |
|
|
|
35,070 |
|
|
|
132,701 |
|
|
|
144,406 |
|
Research and development |
|
1,150 |
|
|
|
2,722 |
|
|
|
5,103 |
|
|
|
10,110 |
|
Amortization of intangible assets |
|
1,550 |
|
|
|
1,250 |
|
|
|
5,758 |
|
|
|
4,578 |
|
Credit loss (reversal) expense, net |
|
(10 |
) |
|
|
170 |
|
|
|
(973 |
) |
|
|
1,759 |
|
Asset impairments |
|
— |
|
|
|
144 |
|
|
|
— |
|
|
|
144 |
|
Restructuring and other charges |
|
3,749 |
|
|
|
1,593 |
|
|
|
3,749 |
|
|
|
2,946 |
|
Income from operations |
|
9,512 |
|
|
|
2,739 |
|
|
|
43,862 |
|
|
|
50,398 |
|
Realized and unrealized investment gains |
|
33 |
|
|
|
29 |
|
|
|
127 |
|
|
|
465 |
|
Retirement benefits non-service expense |
|
(64 |
) |
|
|
(179 |
) |
|
|
(387 |
) |
|
|
(411 |
) |
Interest income |
|
460 |
|
|
|
648 |
|
|
|
2,180 |
|
|
|
2,486 |
|
Interest expense |
|
(1,617 |
) |
|
|
(1,776 |
) |
|
|
(8,084 |
) |
|
|
(6,821 |
) |
Income before taxes |
|
8,324 |
|
|
|
1,461 |
|
|
|
37,698 |
|
|
|
46,117 |
|
Income tax (expense) benefit |
|
(1,458 |
) |
|
|
1,850 |
|
|
|
(4,996 |
) |
|
|
(13,051 |
) |
Net income |
|
6,866 |
|
|
|
3,311 |
|
|
|
32,702 |
|
|
|
33,066 |
|
Net income attributable to non-controlling interests |
|
(1,560 |
) |
|
|
(771 |
) |
|
|
(6,643 |
) |
|
|
(7,731 |
) |
Net income attributable to common shareholders |
$ |
5,306 |
|
|
$ |
2,540 |
|
|
$ |
26,059 |
|
|
$ |
25,335 |
|
|
|
|
|
|
|
|
|
||||||||
Net income per share attributable to common shareholders: |
|
|
|
|
|
|
|
||||||||
Basic |
$ |
0.10 |
|
|
$ |
0.05 |
|
|
$ |
0.49 |
|
|
$ |
0.47 |
|
Diluted |
$ |
0.10 |
|
|
$ |
0.05 |
|
|
$ |
0.48 |
|
|
$ |
0.46 |
|
|
|
|
|
|
|
|
|
||||||||
Weighted average shares outstanding (in thousands): |
|
|
|
|
|
|
|
||||||||
Basic |
|
52,770 |
|
|
|
53,973 |
|
|
|
52,650 |
|
|
|
54,310 |
|
Diluted |
|
54,706 |
|
|
|
54,983 |
|
|
|
53,864 |
|
|
|
55,146 |
|
|
|
|
|
|
|
|
|
||||||||
Additional Disclosure: |
|
|
|
|
|
|
|
||||||||
Depreciation and amortization |
$ |
16,601 |
|
|
$ |
13,545 |
|
|
$ |
65,503 |
|
|
$ |
60,022 |
|
Amortization of deferred financing costs |
$ |
492 |
|
$ |
493 |
|
$ |
1,969 |
|
|
$ |
2,235 |
|||
IMAX CORPORATION CONSOLIDATED BALANCE SHEETS (In thousands of U.S. dollars, except share amounts) |
|||||||
|
December 31, |
|
December 31, |
||||
|
|
2024 |
|
|
|
2023 |
|
Assets |
|
|
|
||||
Cash and cash equivalents |
$ |
100,592 |
|
|
$ |
76,200 |
|
Accounts receivable, net of allowance for credit losses |
|
107,669 |
|
|
|
136,259 |
|
Financing receivables, net of allowance for credit losses |
|
119,885 |
|
|
|
127,154 |
|
Variable consideration receivables, net of allowance for credit losses |
|
82,593 |
|
|
|
64,338 |
|
Inventories |
|
32,840 |
|
|
|
31,584 |
|
Prepaid expenses |
|
13,121 |
|
|
|
12,345 |
|
Film assets, net of accumulated amortization |
|
8,686 |
|
|
|
6,786 |
|
Property, plant and equipment, net of accumulated depreciation |
|
240,133 |
|
|
|
243,299 |
|
Other assets |
|
22,441 |
|
|
|
20,879 |
|
Deferred income tax assets, net of valuation allowance |
|
14,499 |
|
|
|
7,988 |
|
Goodwill |
|
52,815 |
|
|
|
52,815 |
|
Other intangible assets, net of accumulated amortization |
|
35,124 |
|
|
|
35,022 |
|
Total assets |
$ |
830,398 |
|
|
$ |
814,669 |
|
Liabilities |
|
|
|
||||
Accounts payable |
$ |
19,803 |
|
|
$ |
26,386 |
|
Accrued and other liabilities |
|
100,916 |
|
|
|
111,013 |
|
Deferred revenue |
|
52,686 |
|
|
|
67,105 |
|
Revolving credit facility borrowings, net of unamortized debt issuance costs |
|
36,356 |
|
|
|
22,924 |
|
Convertible notes and other borrowings, net of unamortized discounts and debt issuance costs |
|
229,901 |
|
|
|
229,131 |
|
Deferred income tax liabilities |
|
12,521 |
|
|
|
12,521 |
|
Total liabilities |
|
452,183 |
|
|
|
469,080 |
|
Commitments, contingencies and guarantees |
|
|
|
||||
Non-controlling interests |
|
680 |
|
|
|
658 |
|
Shareholders’ equity |
|
|
|
||||
Capital stock common shares — no par value. Authorized — unlimited number. 52,946,200 issued and outstanding (December 31, 2023 — 53,260,276 issued and outstanding) |
|
401,420 |
|
|
|
389,048 |
|
Other equity |
|
185,268 |
|
|
|
185,087 |
|
Statutory surplus reserve |
|
4,051 |
|
|
|
3,932 |
|
Accumulated deficit |
|
(274,675 |
) |
|
|
(292,845 |
) |
Accumulated other comprehensive loss |
|
(16,598 |
) |
|
|
(12,081 |
) |
Total shareholders’ equity attributable to common shareholders |
|
299,466 |
|
|
|
273,141 |
|
Non-controlling interests |
|
78,069 |
|
|
|
71,790 |
|
Total shareholders’ equity |
|
377,535 |
|
|
|
344,931 |
|
Total liabilities and shareholders’ equity |
$ |
830,398 |
|
|
$ |
814,669 |
|
IMAX CORPORATION CONSOLIDATED STATEMENTS OF CASH FLOWS (In thousands of U.S. dollars) |
|||||||
|
Years Ended |
||||||
|
December 31, |
||||||
|
|
2024 |
|
|
|
2023 |
|
Operating Activities |
|
|
|
||||
Net income |
$ |
32,702 |
|
|
$ |
33,066 |
|
Adjustments to reconcile net income to cash provided by operating activities: |
|
|
|
||||
Depreciation and amortization |
|
65,503 |
|
|
|
60,022 |
|
Amortization of deferred financing costs |
|
1,969 |
|
|
|
2,235 |
|
Credit loss (reversal) expense, net |
|
(973 |
) |
|
|
1,759 |
|
Write-downs, including asset impairments |
|
3,973 |
|
|
|
1,884 |
|
Deferred income tax benefit |
|
(5,631 |
) |
|
|
(1,447 |
) |
Share-based and other non-cash compensation |
|
23,209 |
|
|
|
24,230 |
|
Unrealized foreign currency exchange gain |
|
(2,770 |
) |
|
|
(212 |
) |
Realized and unrealized investment gain |
|
(127 |
) |
|
|
(465 |
) |
Changes in assets and liabilities: |
|
|
|
||||
Accounts receivable |
|
29,105 |
|
|
|
(1,907 |
) |
Inventories |
|
(1,501 |
) |
|
|
(285 |
) |
Film assets |
|
(25,122 |
) |
|
|
(20,394 |
) |
Deferred revenue |
|
(14,308 |
) |
|
|
(3,882 |
) |
Changes in other operating assets and liabilities |
|
(35,192 |
) |
|
|
(35,989 |
) |
Net cash provided by operating activities |
|
70,837 |
|
|
|
58,615 |
|
Investing Activities |
|
|
|
||||
Purchase of property, plant and equipment |
|
(8,428 |
) |
|
|
(6,491 |
) |
Investment in equipment for joint revenue sharing arrangements |
|
(24,341 |
) |
|
|
(18,000 |
) |
Acquisition of other intangible assets |
|
(8,447 |
) |
|
|
(8,344 |
) |
Proceeds from sale of equity securities |
|
— |
|
|
|
1,045 |
|
Net cash used in investing activities |
|
(41,216 |
) |
|
|
(31,790 |
) |
Financing Activities |
|
|
|
||||
Proceeds from revolving credit facility borrowings |
|
55,000 |
|
|
|
39,717 |
|
Repayments of revolving credit facility borrowings |
|
(42,000 |
) |
|
|
(53,248 |
) |
Proceeds from other borrowings |
|
— |
|
|
|
322 |
|
Repayments of other borrowings |
|
(874 |
) |
|
|
(53 |
) |
Credit facility amendment fees paid |
|
— |
|
|
|
(46 |
) |
Repurchase of common shares, IMAX Corporation |
|
(17,855 |
) |
|
|
(26,823 |
) |
Repurchase of common shares, IMAX China |
|
(116 |
) |
|
|
(15 |
) |
Taxes withheld and paid on employee stock awards vested |
|
(4,978 |
) |
|
|
(6,466 |
) |
Common shares issued - stock options exercised |
|
5,291 |
|
|
|
— |
|
Principal payment under finance lease obligations |
|
(509 |
) |
|
|
(480 |
) |
Dividends paid to non-controlling interests |
|
— |
|
|
|
(1,438 |
) |
Net cash used in financing activities |
|
(6,041 |
) |
|
|
(48,530 |
) |
Effects of exchange rate changes on cash |
|
812 |
|
|
|
504 |
|
Increase (decrease) in cash and cash equivalents during year |
|
24,392 |
|
|
|
(21,201 |
) |
Cash and cash equivalents, beginning of year |
|
76,200 |
|
|
|
97,401 |
|
Cash and cash equivalents, end of year |
$ |
100,592 |
|
|
$ |
76,200 |
|
Primary Reporting Groups
The Company’s Chief Executive Officer (“CEO”) is its Chief Operating Decision Maker (“CODM”), as such term is defined under U.S. GAAP. The CODM assesses segment performance based on segment revenues and segment gross margins. Selling, general and administrative expenses, research and development costs, the amortization of intangible assets, provision for (reversal of) current expected credit losses, certain write-downs, interest income, interest expense, and income tax (expense) benefit are not allocated to the Company’s segments.
The Company has two reportable segments:
(i) |
|
Content Solutions, consists of services provided to studios and other content creators, which principally includes the digital remastering of films and other content into IMAX formats for distribution to the IMAX network. To a lesser extent, the Content Solutions segment also earns revenue from the distribution of large-format documentary films and exclusive experiences ranging from live performances to interactive events with leading artists and creators, as well as film post-production services. |
|
|
|
(ii) |
|
Technology Products and Services, which includes results from the sale or lease of IMAX Systems, as well as from the maintenance of IMAX Systems to exhibition customers. To a lesser extent, the Technology Product and Services segment also earns revenue from certain ancillary theater business activities, including after-market sales of IMAX System parts and 3D glasses. |
Segment Revenue and Gross Margin
|
Three Months Ended |
|
Years Ended |
||||||||||||
|
December 31,
|
|
December 31, |
||||||||||||
(In thousands of U.S. dollars) |
|
2024 |
|
|
|
2023 |
|
|
|
2024 |
|
|
|
2023 |
|
Revenue |
|
|
|
|
|
|
|
||||||||
Content Solutions |
$ |
25,513 |
|
|
$ |
19,093 |
|
|
$ |
124,731 |
|
|
$ |
126,698 |
|
Technology Products and Services |
|
64,043 |
|
|
|
62,490 |
|
|
|
216,062 |
|
|
|
234,303 |
|
Sub-total for reportable segments |
|
89,556 |
|
|
|
81,583 |
|
|
|
340,793 |
|
|
|
361,001 |
|
All Other(1) |
|
3,116 |
|
|
|
4,435 |
|
|
|
11,415 |
|
|
|
13,838 |
|
Total |
$ |
92,672 |
|
|
$ |
86,018 |
|
|
$ |
352,208 |
|
|
$ |
374,839 |
|
|
|
|
|
|
|
|
|
||||||||
Gross Margin |
|
|
|
|
|
|
|
||||||||
Content Solutions |
$ |
11,837 |
|
|
$ |
9,709 |
|
|
$ |
66,523 |
|
|
$ |
74,106 |
|
Technology Products and Services |
|
34,222 |
|
|
|
29,880 |
|
|
|
115,553 |
|
|
|
129,946 |
|
Sub-total for reportable segments |
|
46,059 |
|
|
|
39,589 |
|
|
|
182,076 |
|
|
|
204,052 |
|
All Other(1) |
|
2,306 |
|
|
|
4,099 |
|
|
|
8,124 |
|
|
|
10,289 |
|
Total |
$ |
48,365 |
|
|
$ |
43,688 |
|
|
$ |
190,200 |
|
|
$ |
214,341 |
|
_______________ |
||
(1) |
|
All Other includes the results from the Company’s streaming and consumer technology business, as well as other ancillary activities. |
IMAX CORPORATION
NON-GAAP FINANCIAL MEASURES
In this release, the Company presents adjusted net income attributable to common shareholders and adjusted net income attributable to common shareholders per basic and diluted share, EBITDA, Adjusted EBITDA per Credit Facility, Adjusted EBITDA margin as supplemental measures of the Company’s performance, which are not recognized under U.S. GAAP. Adjusted net income or loss attributable to common shareholders and adjusted net income or loss attributable to common shareholders per basic and diluted share exclude, where applicable: (i) share-based compensation; (ii) realized and unrealized investment gains or losses; (iii) transaction-related expenses; and (iv) restructuring and other charges, as well as the related tax impact of these adjustments.
The Company believes that these non-GAAP financial measures are important supplemental measures that allow management and users of the Company’s financial statements to view operating trends and analyze controllable operating performance on a comparable basis between periods without the after-tax impact of share-based compensation and certain unusual items included in net income attributable to common shareholders. Although share-based compensation is an important aspect of the Company’s employee and executive compensation packages, it is a non-cash expense and is excluded from certain internal business performance measures.
A reconciliation from net income (loss) attributable to common shareholders and the associated per share amounts to adjusted net income attributable to common shareholders and adjusted net income attributable to common shareholders per diluted share is presented in the table below. Net income (loss) attributable to common shareholders and the associated per share amounts are the most directly comparable GAAP measures because they reflect the earnings relevant to the Company’s shareholders, rather than the earnings attributable to non-controlling interests.
In addition to the non-GAAP financial measures discussed above, management also uses “EBITDA,” as such term is defined in the Credit Agreement, and which is referred to herein as “Adjusted EBITDA per Credit Facility.” As allowed by the Credit Agreement, Adjusted EBITDA per Credit Facility includes adjustments in addition to the exclusion of interest, taxes, depreciation and amortization. Accordingly, this non-GAAP financial measure is presented to allow a more comprehensive analysis of the Company’s operating performance and to provide additional information with respect to the Company’s compliance with its Credit Agreement requirements, when applicable. In addition, the Company believes that Adjusted EBITDA per Credit Facility presents relevant and useful information widely used by analysts, investors and other interested parties in the Company’s industry to evaluate, assess and benchmark the Company’s results.
EBITDA is defined as net income or loss excluding: (i) income tax expense or benefit; (ii) interest expense, net of interest income; (iii) depreciation and amortization, including film asset amortization; and (iv) amortization of deferred financing costs. Adjusted EBITDA per Credit Facility is defined as EBITDA excluding: (i) share-based and other non-cash compensation; (ii) realized and unrealized investment gains or losses; (iii) transaction-related expenses; (iv) restructuring and other charges costs; and (v) write- downs, net of recoveries, including asset impairments and credit loss expense or reversal.
A reconciliation of net income (loss) attributable to common shareholders, which is the most directly comparable GAAP measure, to EBITDA and Adjusted EBITDA per Credit Facility is presented in the table below. Net income (loss) attributable to common shareholders is the most directly comparable GAAP measure because it reflects the earnings relevant to the Company’s shareholders, rather than the earnings attributable to non-controlling interests.
In this release, the Company also presents free cash flow, which is not recognized under U.S. GAAP, as a supplemental measure of the Company’s liquidity. The Company definition of free cash flow deducts only normal recurring capital expenditures, including the Company’s investment in joint revenue sharing arrangements, the purchase of property, plant and equipment and the acquisition of other intangible assets (from the Consolidated Statements of Cash Flows), from net cash provided by or used in operating activities. Management believes that free cash flow is a supplemental measure of the cash flow available to reduce debt, add to cash balances, and fund other financing activities. Free cash flow does not represent residual cash flow available for discretionary expenditures. A reconciliation of cash provided by operating activities to free cash flow is presented below.
These non-GAAP measures may not be comparable to similarly titled amounts reported by other companies. Additionally, the non-GAAP financial measures used by the Company should not be considered as a substitute for, or superior to, the comparable GAAP amounts.
Adjusted EBITDA per Credit Facility
|
Three Months Ended
|
||||||
(In thousands of U.S. Dollars) |
December 31, 2024 |
|
December 31, 2023 |
||||
Revenues |
$ |
92,672 |
|
|
$ |
86,018 |
|
Reported net income |
$ |
6,866 |
|
|
$ |
3,311 |
|
Add (subtract): |
|
|
|
||||
Income tax expense |
|
1,458 |
|
|
|
(1,850 |
) |
Interest expense, net of interest income |
|
665 |
|
|
|
636 |
|
Depreciation and amortization, including film asset amortization |
|
16,601 |
|
|
|
13,545 |
|
Amortization of deferred financing costs(1) |
|
492 |
|
|
|
493 |
|
EBITDA |
$ |
26,082 |
|
|
$ |
16,135 |
|
Share-based and other non-cash compensation |
|
5,948 |
|
|
|
6,400 |
|
Unrealized investment gains |
|
(33 |
) |
|
|
(29 |
) |
Transaction-related expenses |
|
— |
|
|
|
327 |
|
Restructuring and other charges(2) |
|
3,749 |
|
|
|
1,593 |
|
Write-downs, including asset impairments and credit loss reversal |
|
1,452 |
|
|
|
812 |
|
Total Adjusted EBITDA |
$ |
37,198 |
|
|
$ |
25,238 |
|
Total Adjusted EBITDA margin |
|
40.1 |
% |
|
|
29.3 |
% |
Less: Non-controlling interest |
|
(2,990 |
) |
|
|
(2,221 |
) |
Adjusted EBITDA per Credit Facility - attributable to common shareholders |
$ |
34,208 |
|
|
$ |
23,017 |
|
_______________ |
||
(1) |
|
The amortization of deferred financing costs is recorded within Interest Expense in the Condensed Consolidated Statement of Operations. |
(2) |
|
Reflects restructuring related costs in connection with capturing efficiencies, centralizing certain operational roles and costs incurred in connection with the Company’s internal asset sale. |
Twelve Months Ended |
|||||||
(In thousands of U.S. Dollars) |
December 31, 2024(1) |
|
December 31, 2023(1) |
||||
Revenues |
$ |
352,208 |
|
|
$ |
374,839 |
|
Reported net income |
$ |
32,702 |
|
|
$ |
33,066 |
|
Add (subtract): |
|
|
|
||||
Income tax expense |
|
4,996 |
|
|
|
13,051 |
|
Interest expense, net of interest income |
|
3,936 |
|
|
|
2,101 |
|
Depreciation and amortization, including film asset amortization |
|
65,503 |
|
|
|
60,022 |
|
Amortization of deferred financing costs(2) |
|
1,969 |
|
|
|
2,235 |
|
EBITDA |
$ |
109,106 |
|
|
$ |
110,475 |
|
Share-based and other non-cash compensation |
|
23,209 |
|
|
|
24,230 |
|
Unrealized investment gains |
|
(127 |
) |
|
|
(465 |
) |
Transaction-related expenses |
|
— |
|
|
|
3,569 |
|
Restructuring and other charges(3) |
|
3,749 |
|
|
|
2,946 |
|
Write-downs, including asset impairments and credit loss reversal |
|
2,999 |
|
|
|
3,273 |
|
Total Adjusted EBITDA |
$ |
138,936 |
|
|
$ |
144,028 |
|
Total Adjusted EBITDA margin |
|
39.4 |
% |
|
|
38.4 |
% |
Less: Non-controlling interest |
$ |
(14,191 |
) |
|
$ |
(15,869 |
) |
Adjusted EBITDA per Credit Facility - attributable to common shareholders |
$ |
124,745 |
|
|
$ |
128,159 |
|
_______________ |
||
(1) |
|
The Senior Secured Net Leverage Ratio is calculated using Adjusted EBITDA per Credit Facility determined on a trailing twelve-month basis. |
(2) |
|
The amortization of deferred financing costs is recorded within Interest Expense in the Condensed Consolidated Statement of Operations. |
(3) |
|
Reflects restructuring related costs in connection with capturing efficiencies, centralizing certain operational roles and costs incurred in connection with the Company’s internal asset sale. |
Adjusted Net Income Attributable to Common Shareholders and Adjusted Net Income Per Share
|
Three Months Ended December 31, 2024 (Unaudited) |
|
Three Months Ended December 31, 2023 |
||||||||||||
(In thousands of U.S. Dollars, except per share amounts) |
Net Income |
|
Per Diluted Share |
|
Net Income |
|
Per Diluted Share |
||||||||
Net income attributable to common shareholders |
$ |
5,306 |
|
|
$ |
0.10 |
|
|
$ |
2,540 |
|
|
$ |
0.05 |
|
Adjustments(1): |
|
|
|
|
|
|
|
||||||||
Share-based compensation |
|
5,768 |
|
|
|
0.11 |
|
|
|
6,074 |
|
|
|
0.11 |
|
Unrealized investment gains |
|
(33 |
) |
|
|
— |
|
|
|
(32 |
) |
|
|
— |
|
Transaction-related expenses |
|
— |
|
|
|
— |
|
|
|
119 |
|
|
|
— |
|
Restructuring and other charges(2) |
|
3,749 |
|
|
|
0.07 |
|
|
|
1,335 |
|
|
|
0.02 |
|
Tax impact on items listed above |
|
(322 |
) |
|
|
(0.01 |
) |
|
|
(747 |
) |
|
|
(0.01 |
) |
Adjusted net income(1) |
$ |
14,468 |
|
|
$ |
0.27 |
|
|
$ |
9,289 |
|
|
$ |
0.17 |
|
|
|
|
|
|
|
|
|
||||||||
Weighted average shares outstanding (in thousands): |
|
|
|
|
|
|
|
||||||||
Basic |
|
|
|
52,770 |
|
|
|
|
|
53,973 |
|
||||
Diluted |
|
|
|
54,706 |
|
|
|
|
|
54,983 |
|
||||
_______________ |
||
(1) |
|
Reflects amounts attributable to common shareholders. |
|
Years Ended December 31, |
||||||||||||||
|
2024 |
|
2023 |
||||||||||||
(In thousands of U.S. Dollars, except per share amounts) |
Net Income |
|
Per Diluted Share |
|
Net Income |
|
Per Diluted Share |
||||||||
Net income attributable to common shareholders |
$ |
26,059 |
|
|
$ |
0.48 |
|
|
$ |
25,335 |
|
|
$ |
0.46 |
|
Adjustments(1): |
|
|
|
|
|
|
|
||||||||
Share-based compensation |
|
22,454 |
|
|
|
0.42 |
|
|
|
23,184 |
|
|
|
0.42 |
|
Unrealized investment gains |
|
(127 |
) |
|
|
— |
|
|
|
(558 |
) |
|
|
(0.01 |
) |
Transaction-related expenses |
|
— |
|
|
|
— |
|
|
|
3,361 |
|
|
|
0.06 |
|
Restructuring and other charges(2) |
|
3,749 |
|
|
|
0.07 |
|
|
|
2,688 |
|
|
|
0.05 |
|
Tax impact on items listed above |
|
(1,125 |
) |
|
|
(0.02 |
) |
|
|
(1,931 |
) |
|
|
(0.04 |
) |
Adjusted net income(1) |
$ |
51,010 |
|
|
$ |
0.95 |
|
|
$ |
52,079 |
|
|
$ |
0.94 |
|
|
|
|
|
|
|
|
|
||||||||
Weighted average shares outstanding (in thousands): |
|
|
|
|
|
|
|
||||||||
Basic |
|
|
|
52,650 |
|
|
|
|
|
54,310 |
|
||||
Diluted |
|
|
|
53,864 |
|
|
|
|
|
55,146 |
|
||||
_______________ |
||
(1) |
|
Reflects amounts attributable to common shareholders. |
(2) |
|
Reflects restructuring related costs in connection with capturing efficiencies, centralizing certain operational roles and costs incurred in connection with the Company’s internal asset sale. |
Free Cash Flow
|
Years Ended |
||||||
|
December 31, |
||||||
(In thousands of U.S. Dollars) |
|
2024 |
|
|
|
2023 |
|
Net cash provided by operating activities |
$ |
70,837 |
|
|
$ |
58,615 |
|
Purchase of property, plant and equipment |
|
(8,428 |
) |
|
|
(6,491 |
) |
Acquisition of other intangible assets |
|
(8,447 |
) |
|
|
(8,344 |
) |
Free cash flow before growth CAPEX(1) |
|
53,962 |
|
|
|
43,780 |
|
Investment in equipment for joint revenue sharing arrangements |
|
(24,341 |
) |
|
|
(18,000 |
) |
Free cash flow |
$ |
29,621 |
|
|
$ |
25,780 |
|
_______________ |
||
(1) |
|
Growth CAPEX is defined as capital expenditures associated with investments in equipment for joint revenue sharing arrangements. |
View source version on businesswire.com: https://www.businesswire.com/news/home/20250219198942/en/
Contacts
For additional information please contact:
Investors:
IMAX Corporation, New York
Jennifer Horsley
212-821-0154
jhorsley@IMAX.com
Media:
IMAX Corporation, New York
Mark Jafar
212-821-0102
mjafar@imax.com


